QUESTION IMAGE
Question
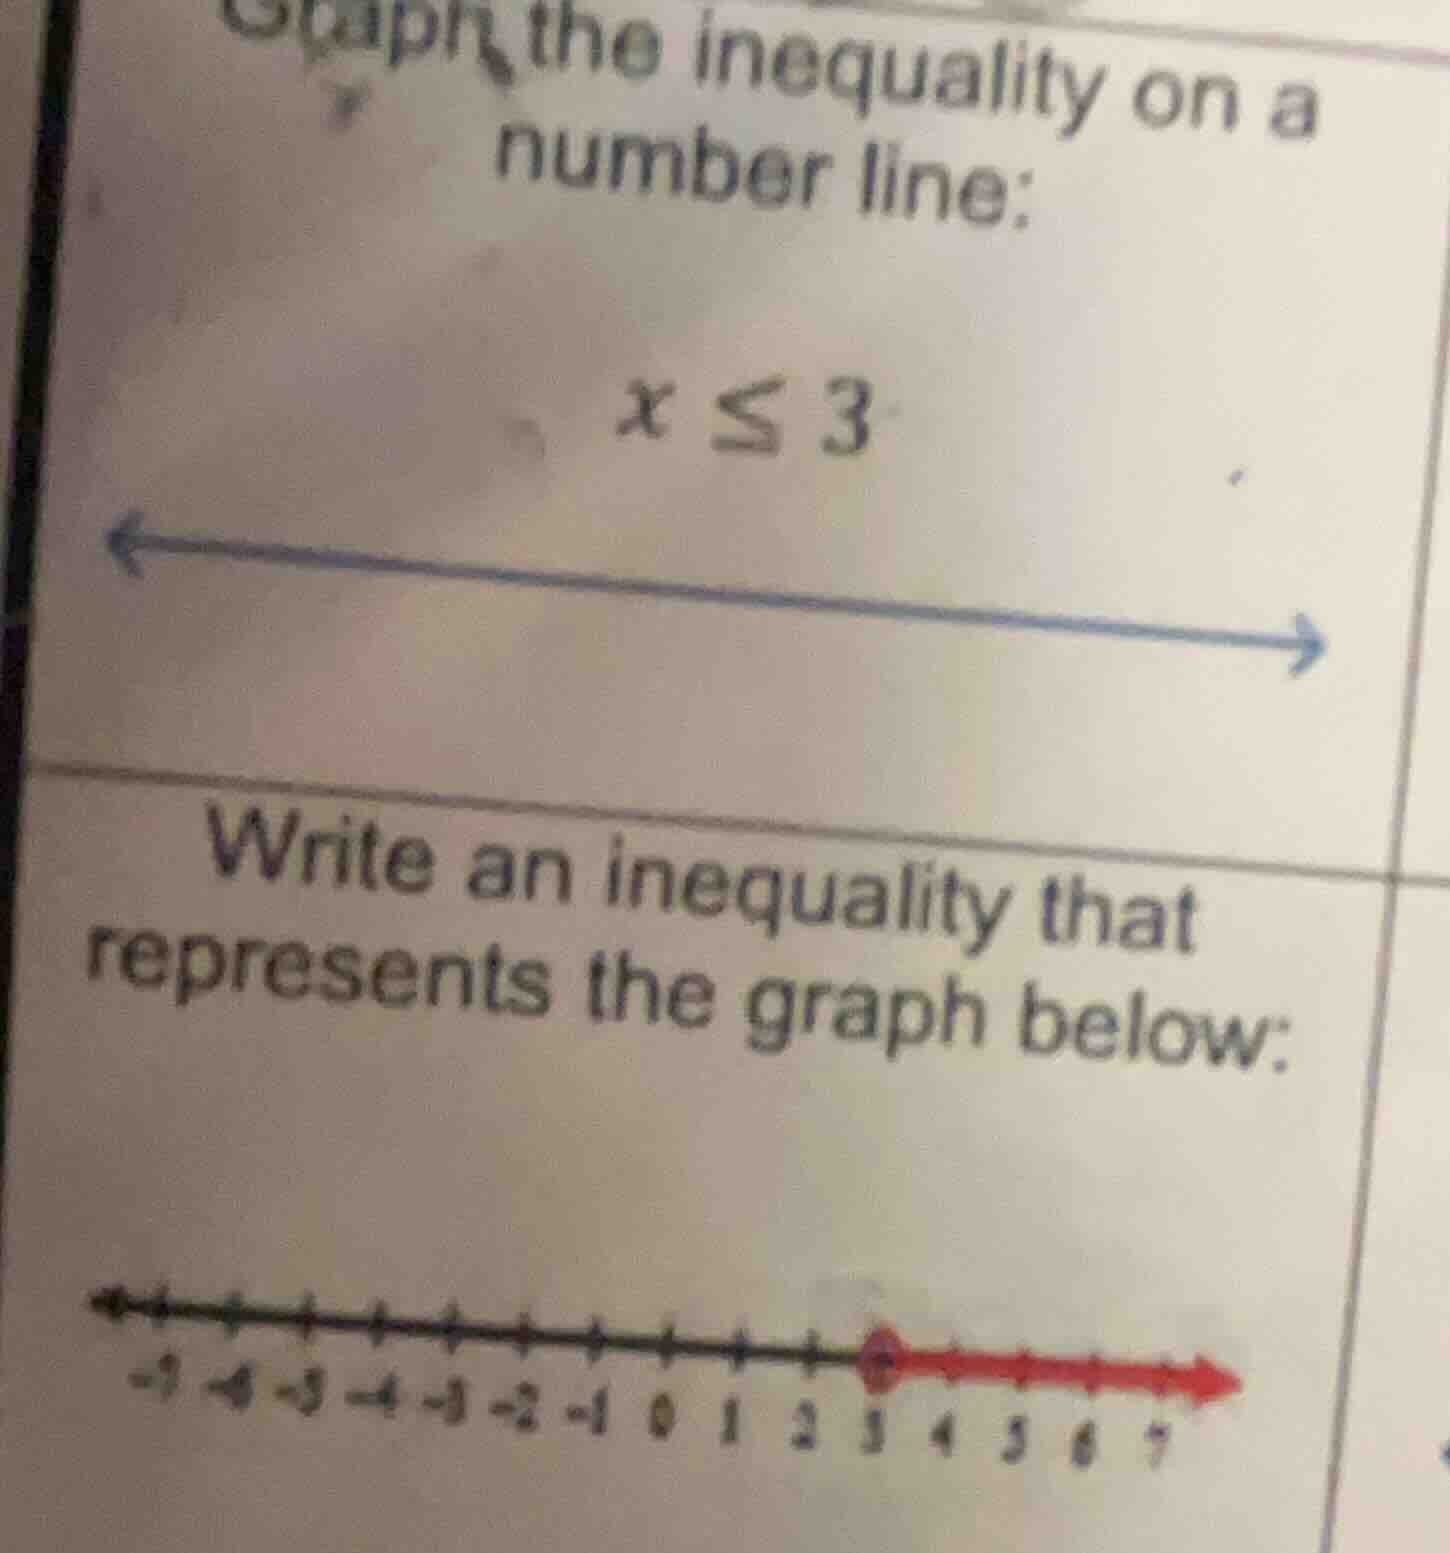
graph the inequality on a number line:
x ≤ 3
write an inequality that represents the graph below:
Step1: Graph $x \leq 3$
Mark a closed dot at 3 (since $\leq$ includes 3), draw an arrow left to show all values less than or equal to 3.
Step2: Analyze the given graph
The graph has a closed dot at 3, arrow pointing right, meaning all values greater than or equal to 3. The inequality is $x \geq 3$.

Snap & solve any problem in the app
Get step-by-step solutions on Sovi AI
Photo-based solutions with guided steps
Explore more problems and detailed explanations
- (Graph for $x \leq 3$): A closed dot at 3, arrow pointing left.
- $x \geq 3$