QUESTION IMAGE
Question
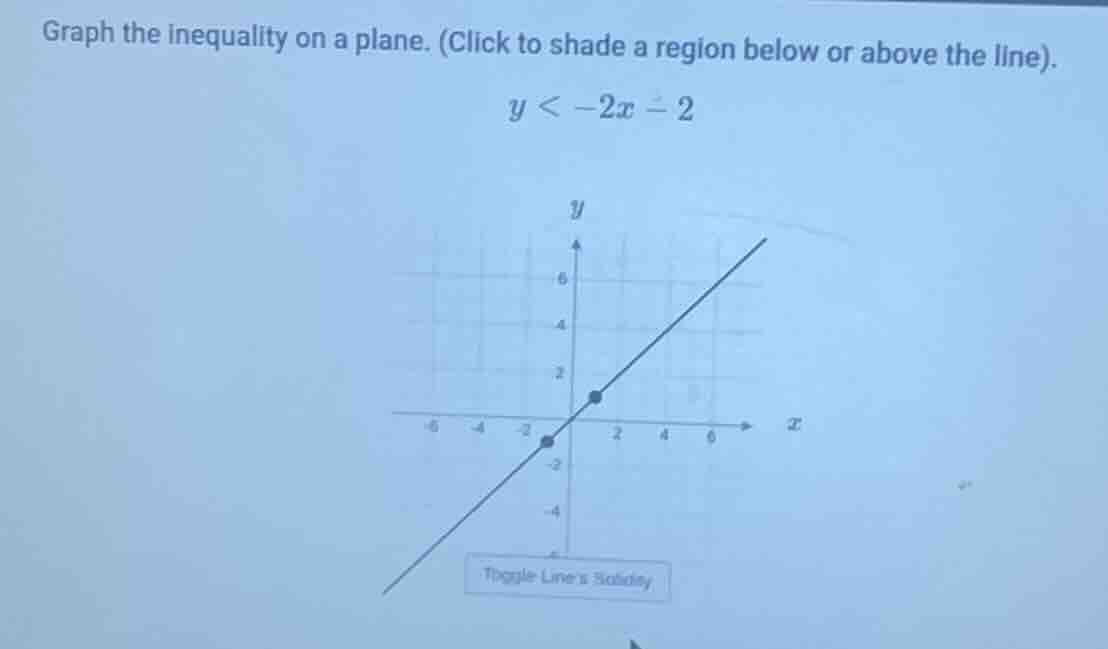
graph the inequality on a plane. (click to shade a region below or above the line).
$y < -2x - 2$
toggle lines solidity
Step1: Identify line type
The inequality is $y < -2x - 2$, which uses a strict less-than sign ($<$), so the boundary line $y=-2x-2$ must be dashed (not solid) to show points on the line are not included.
Step2: Determine shading region
Test a point not on the line, e.g., $(0,0)$:
Substitute into inequality: $0 < -2(0) - 2$ → $0 < -2$, which is false.
Since the test point above the line fails, shade the region below the dashed line.
Step3: Verify line intercepts
For $y=-2x-2$:
- y-intercept: when $x=0$, $y=-2$
- x-intercept: when $y=0$, $0=-2x-2$ → $x=-1$
These match the plotted line's intercepts, so adjust the line to be dashed, then shade below it.

Snap & solve any problem in the app
Get step-by-step solutions on Sovi AI
Photo-based solutions with guided steps
Explore more problems and detailed explanations
- First, set the boundary line $y=-2x-2$ to be dashed (use the "Toggle Line's Solidity" button to change from solid to dashed).
- Shade the entire region below this dashed line.