QUESTION IMAGE
Question
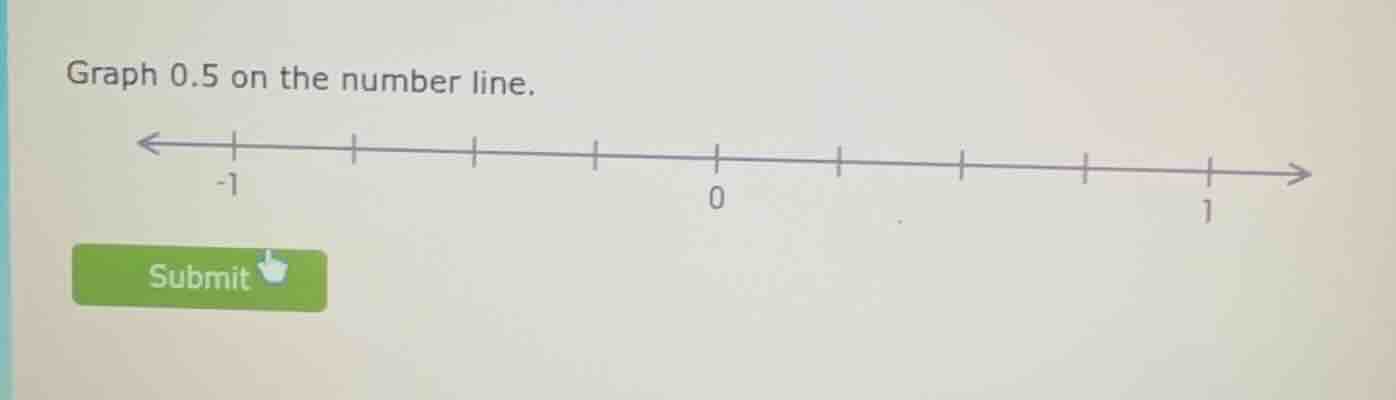
graph 0.5 on the number line. -1 0 1 submit
Step1: Analyze the number line
The number line has marks from -1 to 1, with 0 in the middle. The distance between 0 and 1 is divided into equal parts. Since we need to graph 0.5 (which is $\frac{1}{2}$), we find the midpoint between 0 and 1.
Step2: Locate 0.5
0.5 is halfway between 0 and 1. So on the number line, we identify the tick mark that is exactly in the middle of the segment from 0 to 1 and place a dot (or mark) there to represent 0.5.
(Note: Since this is a graphical representation, the actual action is to mark the midpoint between 0 and 1 on the given number line. The number line provided has equal intervals, so the interval from 0 to 1 has several ticks; the second tick (counting from 0 towards 1) should be the midpoint as the total number of intervals between 0 and 1 can be assumed to be 4? Wait, no, looking at the number line: from -1 to 0, there are 4 ticks? Wait, no, the number line shows -1, then three more ticks, then 0, then three more ticks, then 1? Wait, no, let's count the intervals. From -1 to 0: the distance from -1 to 0 is 1 unit. If there are 4 intervals (since between -1 and 0, there are three ticks, making four intervals? Wait, no, the number of intervals between two points is (number of ticks between them) + 1. Wait, maybe it's simpler: 0.5 is halfway between 0 and 1, so regardless of the number of ticks, the midpoint between 0 and 1 is where 0.5 is. So on the given number line, between 0 and 1, there are three ticks? Wait, the number line shows 0, then a tick, then a tick, then a tick, then 1? Wait, no, the original number line: -1, then three ticks, then 0, then three ticks, then 1. So from 0 to 1, there are three ticks, making four intervals? Wait, no, the distance from 0 to 1 is 1 unit. If there are four intervals (between 0 and the first tick, first and second, second and third, third and 1), then each interval is 1/4 = 0.25. Wait, that can't be. Wait, maybe the number line is divided into four equal parts from -1 to 1? No, -1 to 0 is 1 unit, 0 to 1 is 1 unit. Wait, maybe the number line is divided into eight equal parts? No, this is getting confusing. Alternatively, 0.5 is $\frac{1}{2}$, so it's the midpoint. So regardless of the number of ticks, the midpoint between 0 and 1 is 0.5. So we need to mark the point that is halfway between 0 and 1 on the given number line. So if we look at the number line, between 0 and 1, the second tick (counting from 0) would be at 0.5? Wait, no, let's count: 0, then a tick at 0.25, then 0.5, then 0.75, then 1? Wait, that would be four intervals, each 0.25. So the second tick from 0 towards 1 is 0.5? Wait, no, first tick: 0.25, second: 0.5, third: 0.75, fourth: 1. Yes, so the second tick after 0 is 0.5. So we mark that tick.
But since this is a problem to graph 0.5, the key is to identify the midpoint between 0 and 1 on the number line and place a mark there.

Snap & solve any problem in the app
Get step-by-step solutions on Sovi AI
Photo-based solutions with guided steps
Explore more problems and detailed explanations
To graph 0.5 on the number line, locate the midpoint between 0 and 1 (since 0.5 is halfway between 0 and 1) and place a mark (dot) at that position. On the given number line, this is the second tick mark to the right of 0 (assuming each interval between 0 and 1 is 0.25, so the second interval ends at 0.5).