QUESTION IMAGE
Question
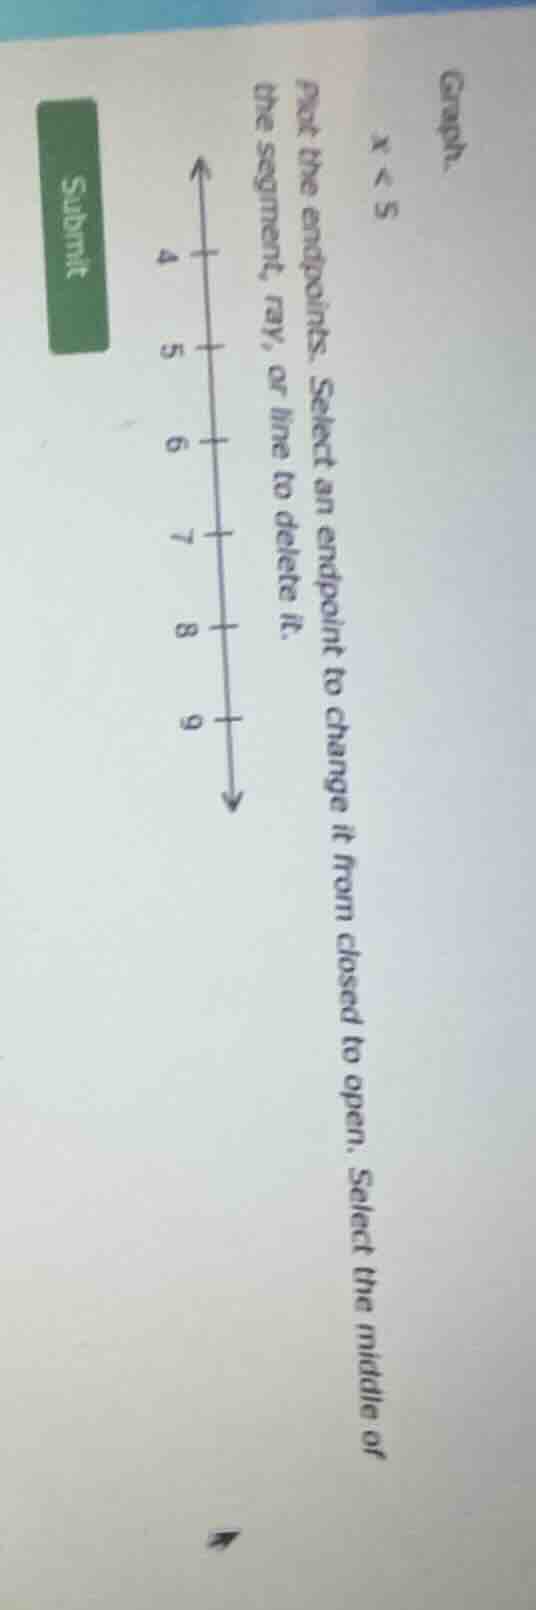
graph
x < 5
pick the endpoints. select an endpoint to change it from closed to open. select the middle of
the segment, ray, or line to delete it.
4 5 6 7 8 9
submit
Step1: Analyze the inequality \(x < 5\)
The inequality \(x < 5\) means all real numbers less than 5. On a number line, we represent this with an open circle (since \(x\) is not equal to 5) at 5 and an arrow pointing to the left (towards smaller numbers).
Step2: Mark the endpoint
- At \(x = 5\), we use an open circle because the inequality is strict (\(x < 5\), not \(x\leqslant5\)).
- Then we draw a ray (a half - line) starting from the open circle at 5 and extending to the left (through 4, 3, 2, etc.).

Snap & solve any problem in the app
Get step-by-step solutions on Sovi AI
Photo-based solutions with guided steps
Explore more problems and detailed explanations
To graph \(x < 5\) on the given number line (with marks at 4, 5, 6, 7, 8, 9):
- At the position of 5 on the number line, place an open circle (this indicates that 5 is not included in the solution set).
- Draw a ray (a line with an arrow) starting from the open circle at 5 and going to the left (towards 4, and further left).