QUESTION IMAGE
Question
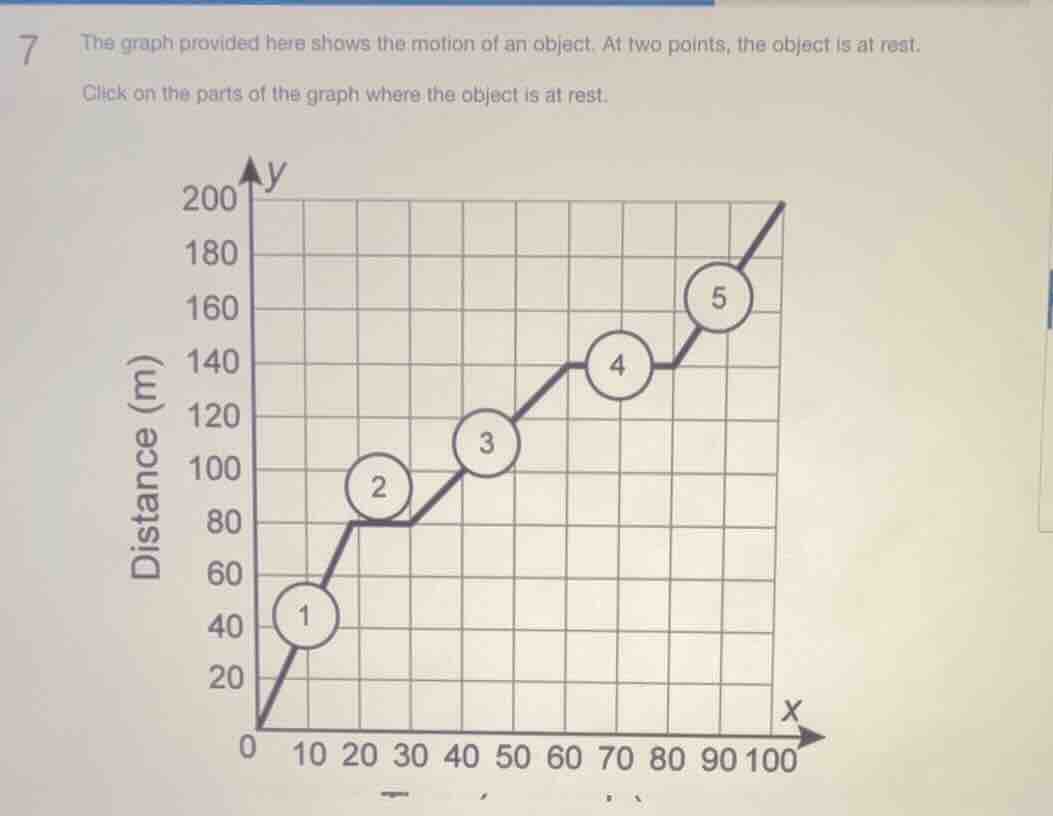
7 the graph provided here shows the motion of an object. at two points, the object is at rest. click on the parts of the graph where the object is at rest.
On a distance-time graph, an object is at rest when the line is horizontal (distance does not change as time increases, meaning velocity = 0). Looking at the graph, the horizontal segments are between point 2 and 3, and between point 4 and 5. The labeled points marking the start/end of these rest periods are point 2, point 3, point 4, point 5, but the specific segments where the object is at rest are the horizontal parts connecting point 2 to 3, and point 4 to 5. The key points identifying these rest regions are the flat sections, corresponding to the parts between the 20-30 x-axis interval (point 2 to 3) and 70-80 x-axis interval (point 4 to 5).

Snap & solve any problem in the app
Get step-by-step solutions on Sovi AI
Photo-based solutions with guided steps
Explore more problems and detailed explanations
The horizontal segments between point 2 and point 3, and between point 4 and point 5 (the flat parts of the graph where distance does not increase with time)