QUESTION IMAGE
Question
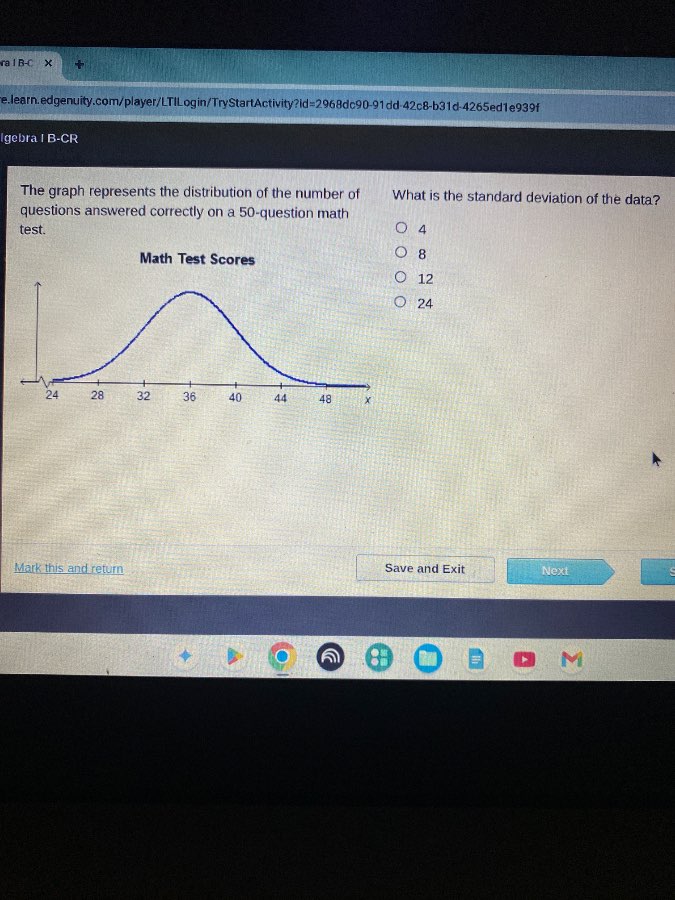
the graph represents the distribution of the number of questions answered correctly on a 50-question math test.
math test scores
what is the standard deviation of the data?
○ 4
○ 8
○ 12
○ 24
Step1: Identify mean of normal curve
The peak of the normal distribution (the highest point of the curve) is at $x=36$, so this is the mean $\mu = 36$.
Step2: Find 1 standard deviation from mean
In a normal distribution, the data is within 1 standard deviation of the mean at the points where the curve transitions from curving upward to downward (the inflection points). These points align with $x=32$ and $x=40$.
Calculate the difference between the mean and one of these points: $\sigma = |36 - 32| = 4$

Snap & solve any problem in the app
Get step-by-step solutions on Sovi AI
Photo-based solutions with guided steps
Explore more problems and detailed explanations
A. 4