QUESTION IMAGE
Question
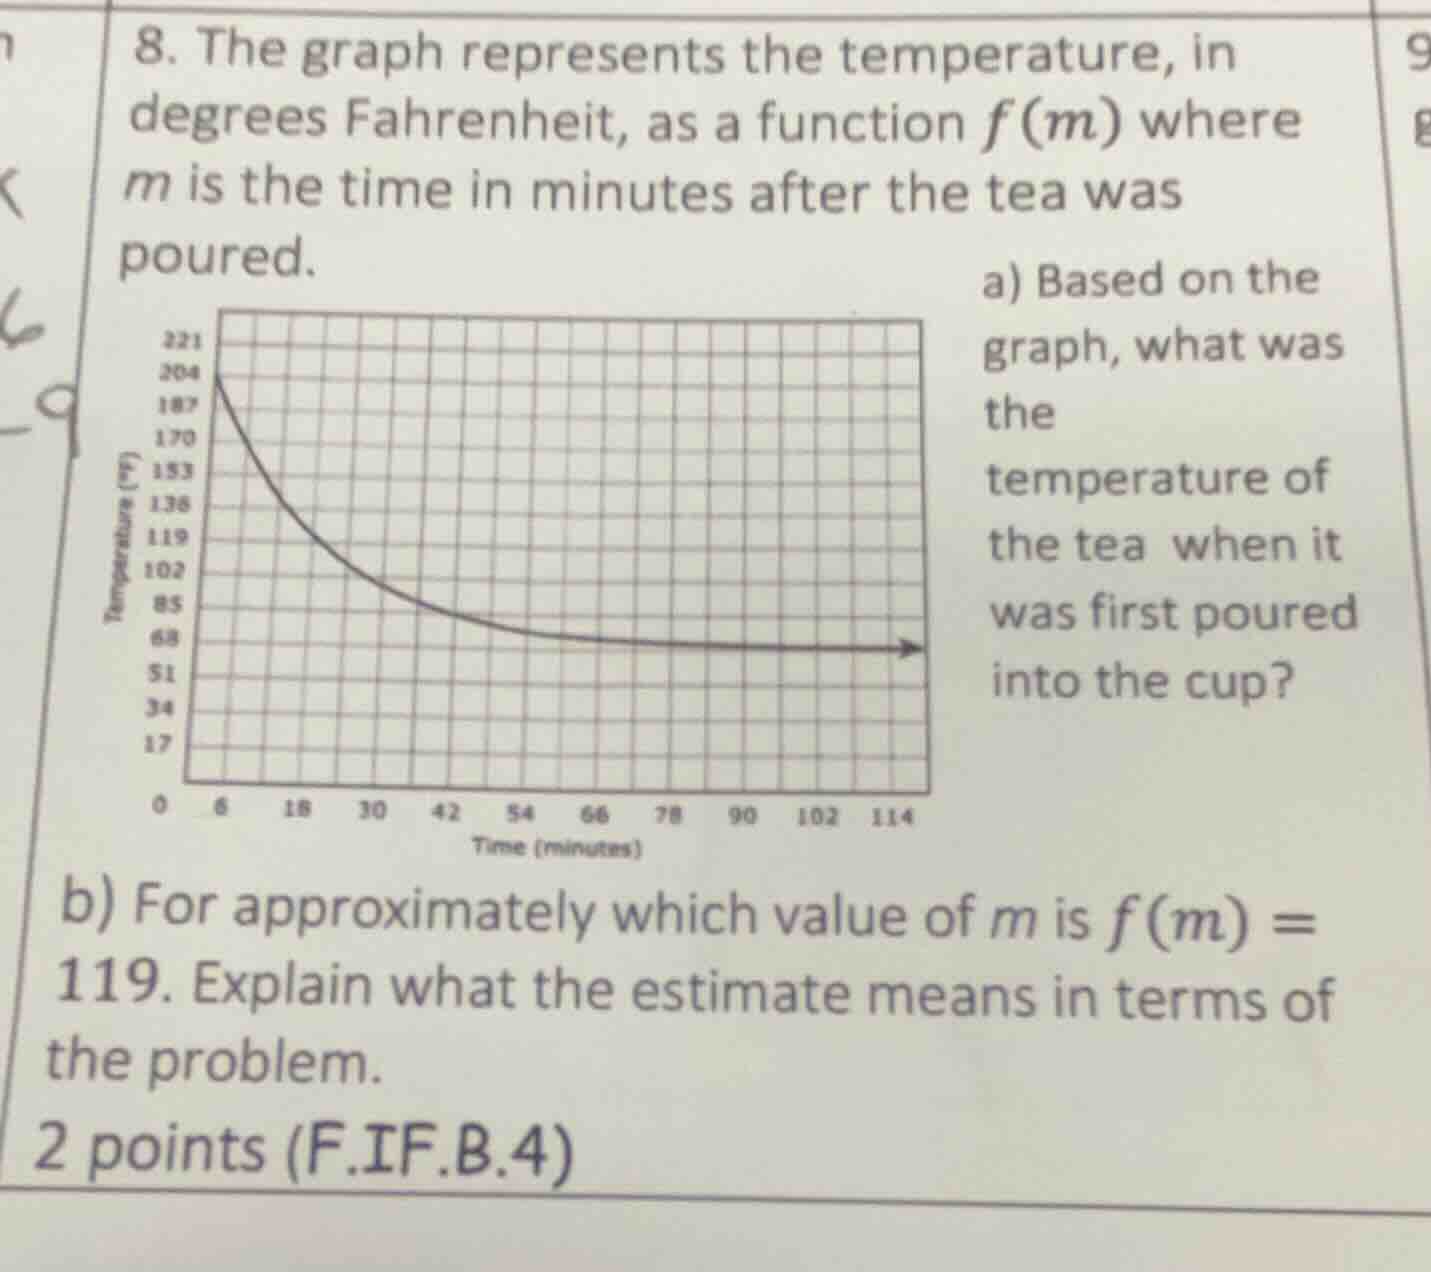
- the graph represents the temperature, in degrees fahrenheit, as a function ( f(m) ) where ( m ) is the time in minutes after the tea was poured.
a) based on the graph, what was the temperature of the tea when it was first poured into the cup?
b) for approximately which value of ( m ) is ( f(m) = 119 ). explain what the estimate means in terms of the problem.
2 points (f.if.b.4)
Part (a)
Step1: Identify the initial time
When the tea is first poured, the time \( m = 0 \) minutes.
Step2: Find the temperature at \( m = 0 \)
Looking at the graph, when \( m = 0 \), the temperature \( f(0) \) corresponds to the y - value at \( x = 0 \). From the graph, at \( m = 0 \), the temperature is 204 degrees Fahrenheit.
Step1: Locate \( f(m)=119 \) on the y - axis
Find the value 119 on the temperature (y - axis) of the graph.
Step2: Find the corresponding \( m \) - value
Trace horizontally from \( y = 119 \) until we hit the graph, then trace down to the x - axis (time in minutes). From the graph, we can see that the corresponding \( m \) - value is approximately 18 minutes.
Step3: Interpret the meaning
The value \( m\approx18 \) minutes means that 18 minutes after the tea was poured, the temperature of the tea is 119 degrees Fahrenheit.

Snap & solve any problem in the app
Get step-by-step solutions on Sovi AI
Photo-based solutions with guided steps
Explore more problems and detailed explanations
204 degrees Fahrenheit