QUESTION IMAGE
Question
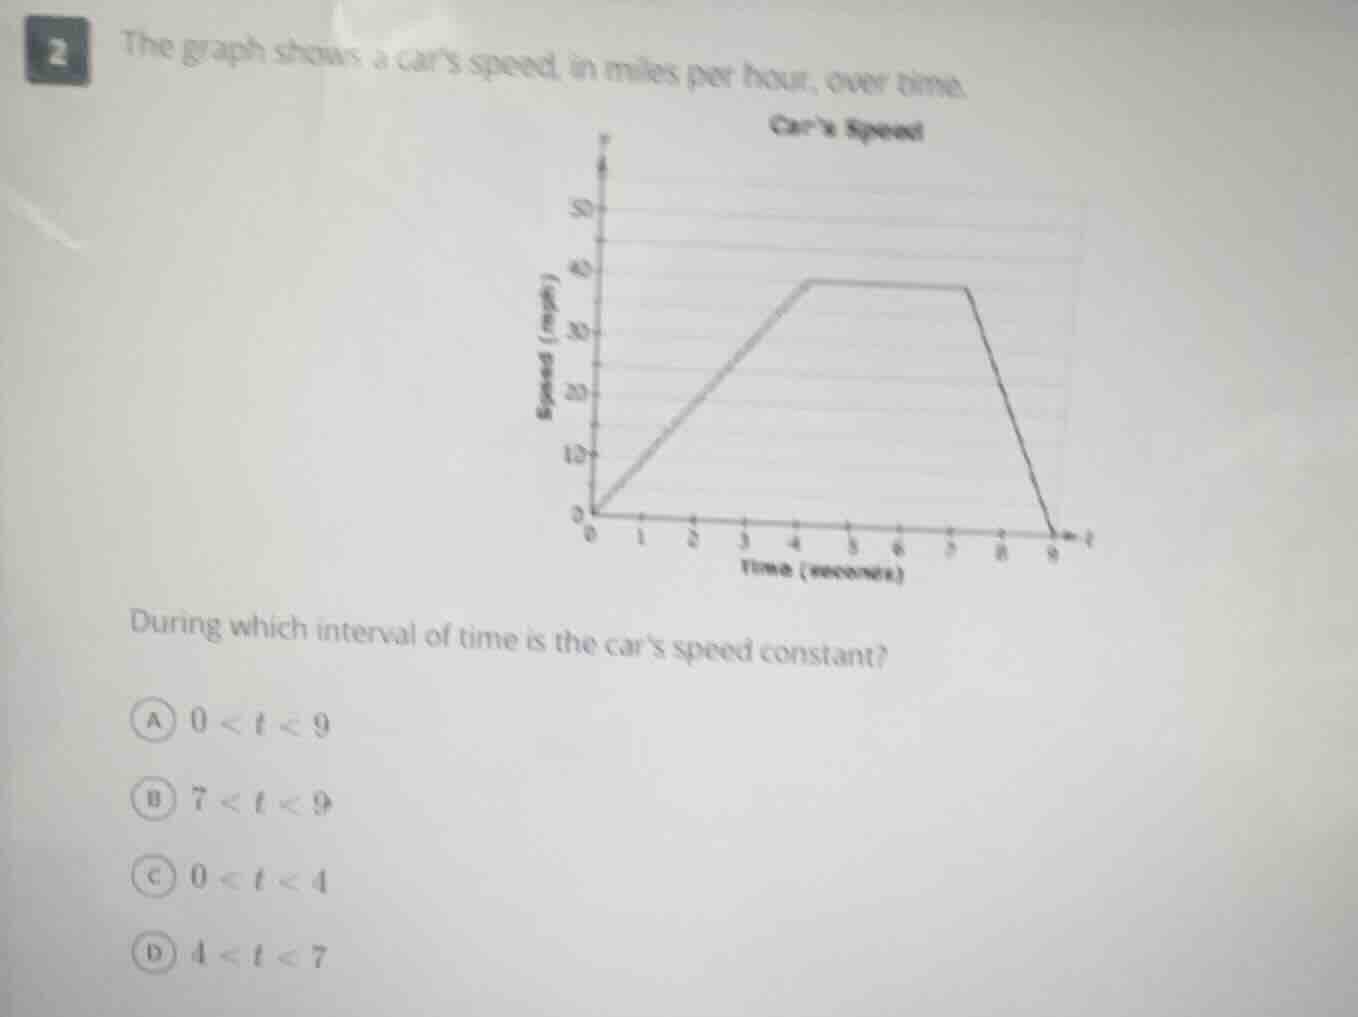
2
the graph shows a cars speed, in miles per hour, over time.
cars speed
during which interval of time is the cars speed constant?
a $0 < t < 9$
b $7 < t < 9$
c $0 < t < 4$
d $4 < t < 7$
Brief Explanations
A constant speed on a speed-time graph appears as a horizontal line, where speed does not change as time increases. Looking at the graph, the horizontal segment occurs between 4 seconds and 7 seconds.

Snap & solve any problem in the app
Get step-by-step solutions on Sovi AI
Photo-based solutions with guided steps
Explore more problems and detailed explanations
D. $4 < t < 7$