QUESTION IMAGE
Question
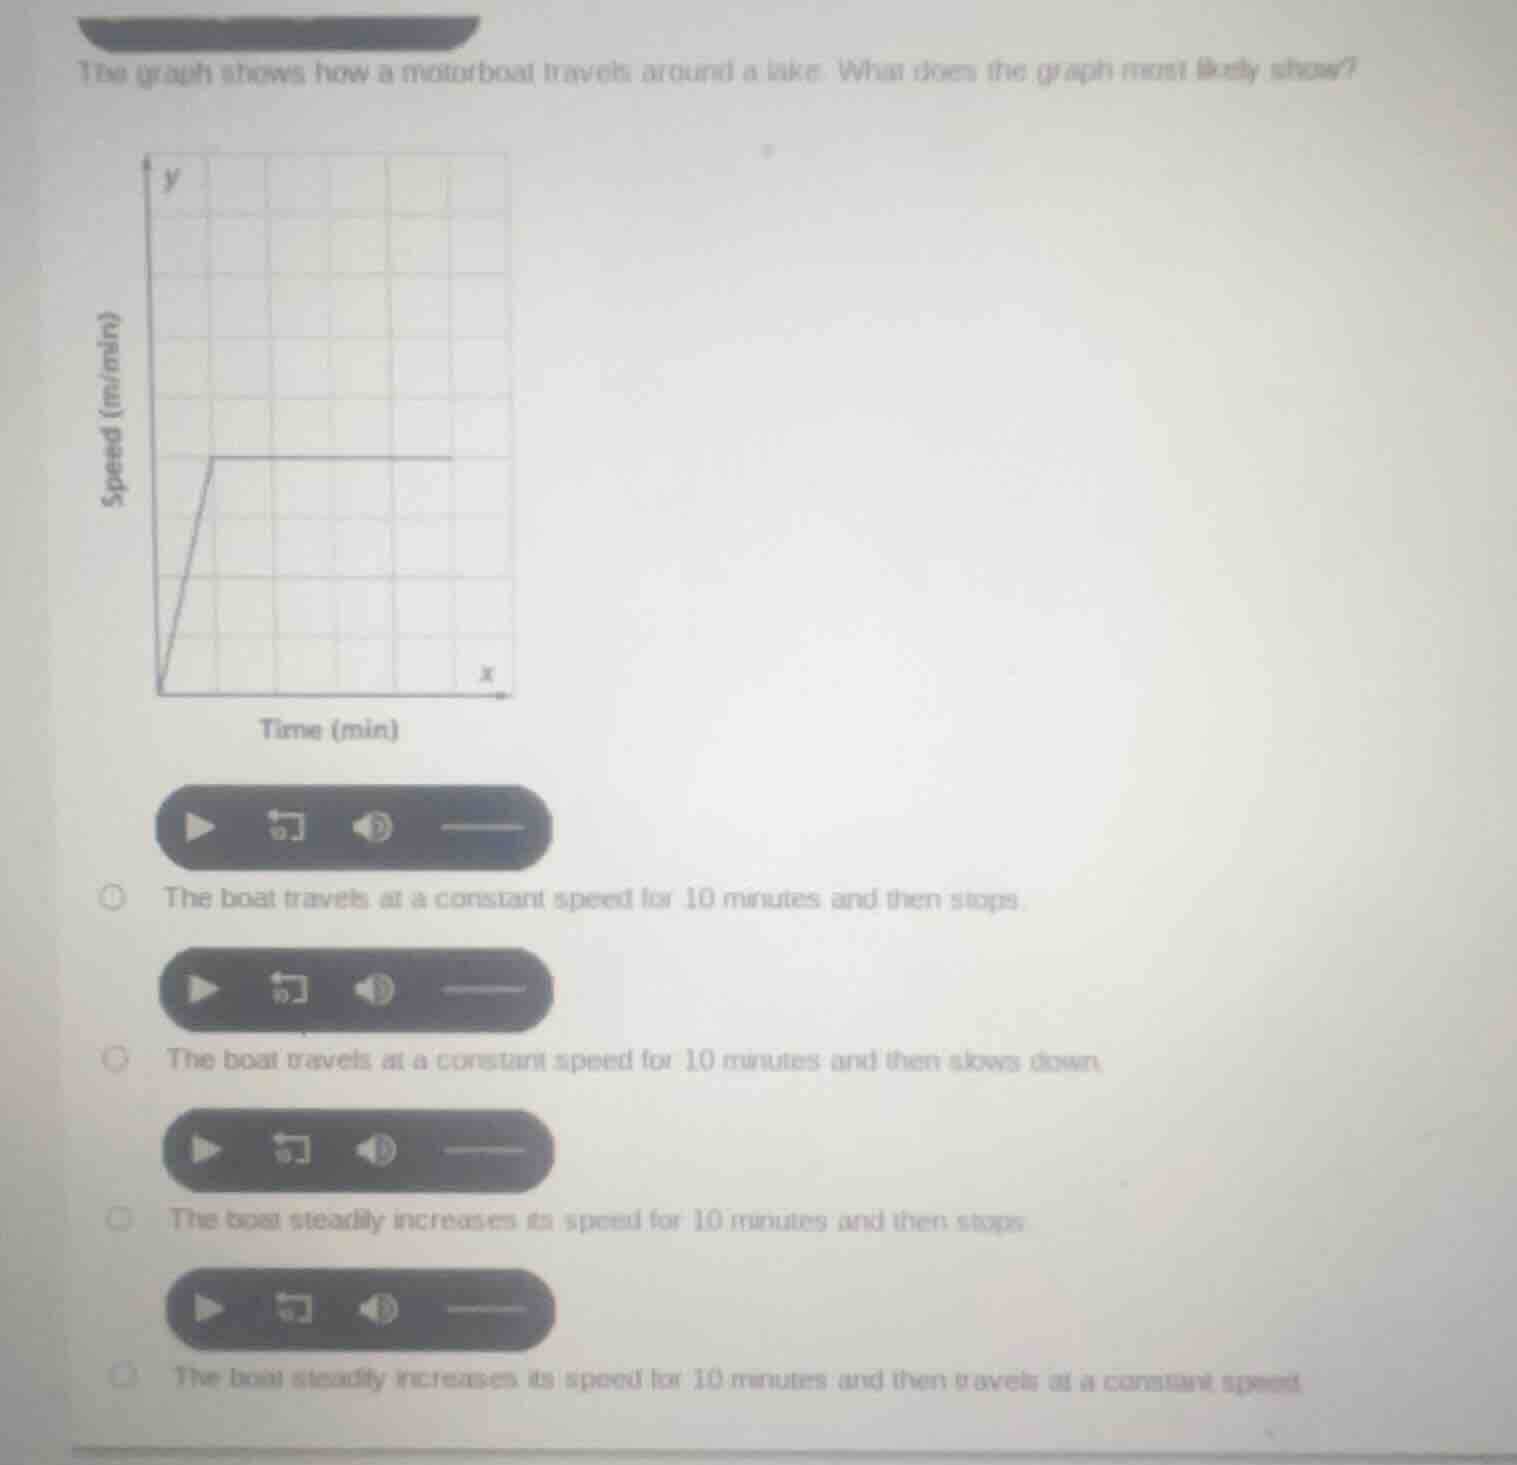
the graph shows how a motorboat travels around a lake. what does the graph most likely show? the boat travels at a constant speed for 10 minutes and then stops. the boat travels at a constant speed for 10 minutes and then slows down. the boat steadily increases its speed for 10 minutes and then stops. the boat steadily increases its speed for 10 minutes and then travels at a constant speed.
- Analyze the graph: The y - axis is speed (m/min) and the x - axis is time (min).
- First segment: The line has a positive slope, which means speed is increasing as time increases (steadily increasing speed for some time).
- Second segment: The line becomes horizontal, which means speed is constant (traveling at a constant speed) as time increases.
- Evaluate options:
- Option 1: The graph does not show the boat stopping (speed would be 0), so this is wrong.
- Option 2: The second segment is constant speed, not slowing down, so this is wrong.
- Option 3: The second segment is constant speed, not stopping, so this is wrong.
- Option 4: Matches the first segment (steadily increasing speed) and the second segment (constant speed).

Snap & solve any problem in the app
Get step-by-step solutions on Sovi AI
Photo-based solutions with guided steps
Explore more problems and detailed explanations
The boat steadily increases its speed for 10 minutes and then travels at a constant speed. (The option corresponding to this description in the multiple - choice, e.g., if it's the fourth option, write "D. The boat steadily increases its speed for 10 minutes and then travels at a constant speed" assuming the options are labeled A - D in order)