QUESTION IMAGE
Question
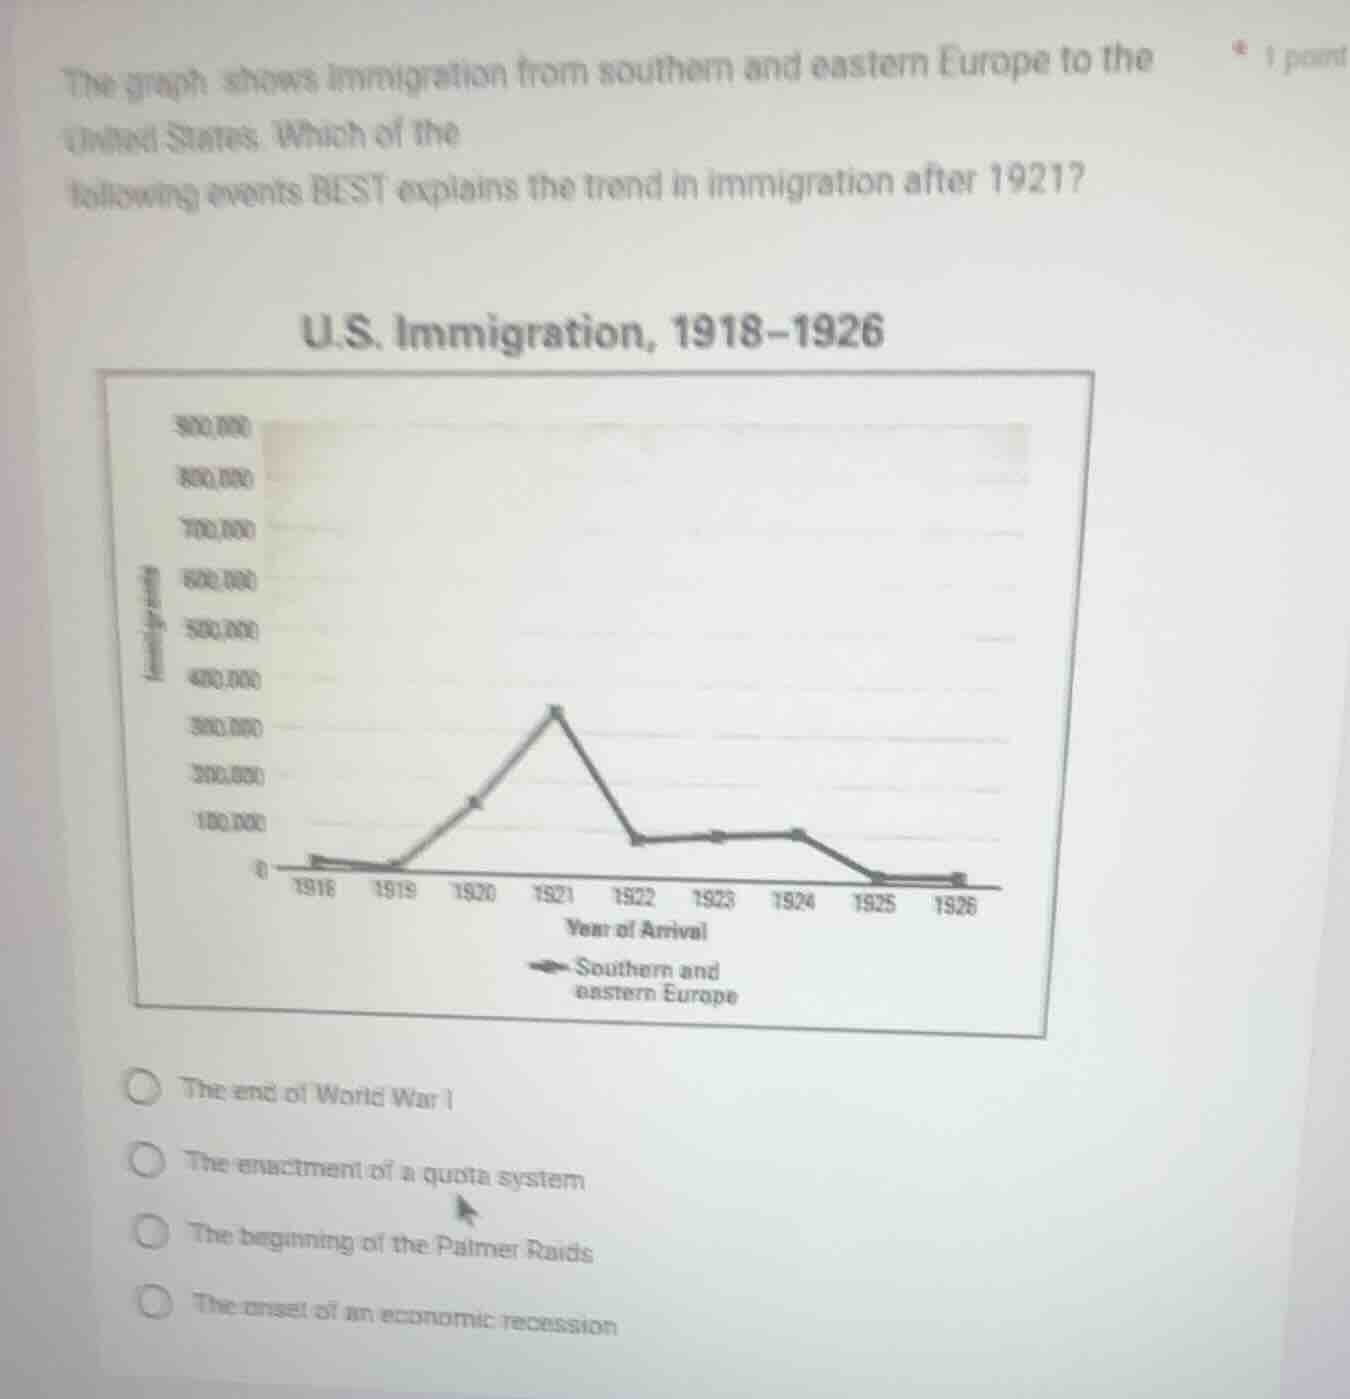
the graph shows immigration from southern and eastern europe to the united states. which of the following events best explains the trend in immigration after 1921? u.s. immigration, 1918–1926 chart omitted the end of world war i the enactment of a quota system the beginning of the palmer raids the onset of an economic recession
The graph shows a sharp drop in immigration from southern and eastern Europe to the U.S. after 1921. The Emergency Quota Act of 1921 (followed by the National Origins Act of 1924) established strict numerical quotas on immigration, specifically targeting immigrants from these regions to limit their numbers. The end of WWI would explain a rise in immigration (as movement resumed post-war), not a drop. The Palmer Raids targeted radicals, not broad immigration levels, and the major recession of the era came later in the 1920s, not aligning with the 1921 drop.

Snap & solve any problem in the app
Get step-by-step solutions on Sovi AI
Photo-based solutions with guided steps
Explore more problems and detailed explanations
The enactment of a quota system