QUESTION IMAGE
Question
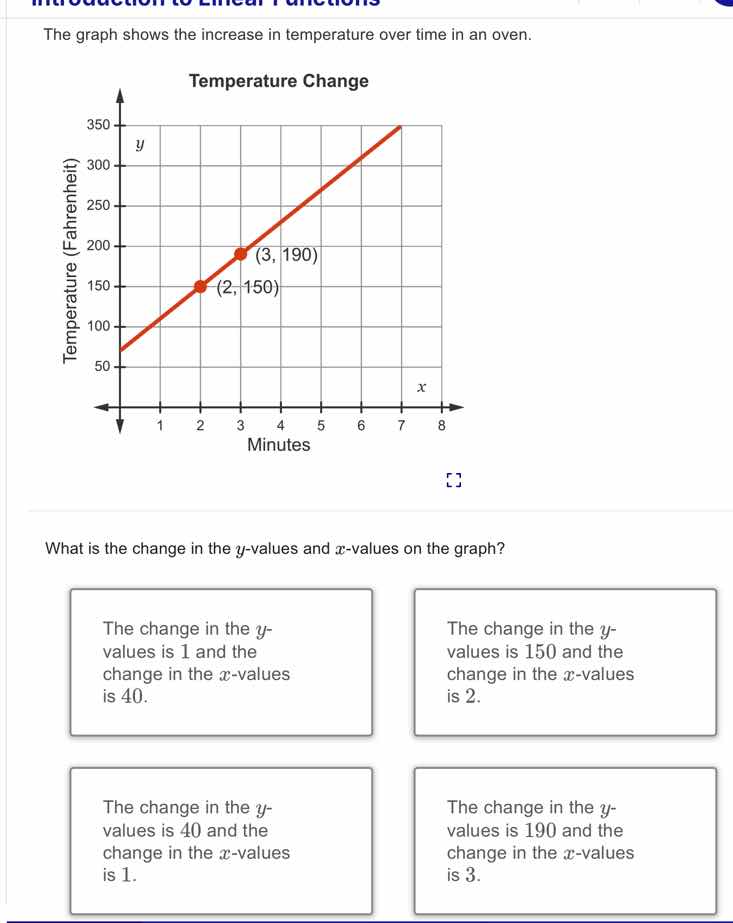
the graph shows the increase in temperature over time in an oven.
temperature change
what is the change in the y-values and x-values on the graph?
the change in the y-values is 1 and the change in the x-values is 40.
the change in the y-values is 150 and the change in the x-values is 2.
the change in the y-values is 40 and the change in the x-values is 1.
the change in the y-values is 190 and the change in the x-values is 3.
Step1: Identify two points
We have two points \((2, 150)\) and \((3, 190)\).
Step2: Calculate change in \(y\)-values
The change in \(y\)-values (also called the rise) is \(y_2 - y_1\). So, \(190 - 150 = 40\).
Step3: Calculate change in \(x\)-values
The change in \(x\)-values (also called the run) is \(x_2 - x_1\). So, \(3 - 2 = 1\).

Snap & solve any problem in the app
Get step-by-step solutions on Sovi AI
Photo-based solutions with guided steps
Explore more problems and detailed explanations
The change in the \(y\)-values is 40 and the change in the \(x\)-values is 1. (Corresponding to the option: "The change in the \(y\)-values is 40 and the change in the \(x\)-values is 1.")