QUESTION IMAGE
Question
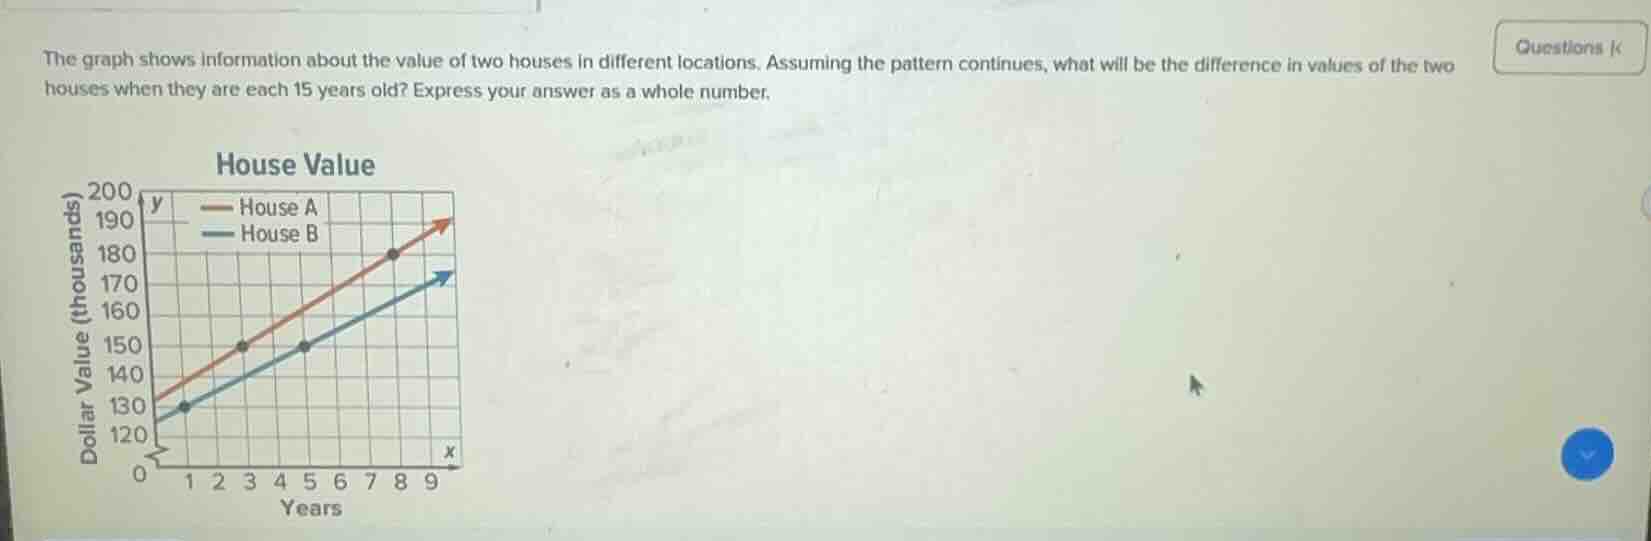
the graph shows information about the value of two houses in different locations. assuming the pattern continues, what will be the difference in values of the two houses when they are each 15 years old? express your answer as a whole number. house value (graph with house a and house b lines, x: years, y: dollar value (thousands))
Step1: Find slope of House A
From points (0, 130) and (3, 150):
Slope $m_A = \frac{150-130}{3-0} = \frac{20}{3}$
Equation: $y_A = \frac{20}{3}x + 130$
Step2: Find slope of House B
From points (0, 125) and (3, 140):
Slope $m_B = \frac{140-125}{3-0} = 5$
Equation: $y_B = 5x + 125$
Step3: Calculate value at x=15 (House A)
$y_A = \frac{20}{3}(15) + 130 = 100 + 130 = 230$
Step4: Calculate value at x=15 (House B)
$y_B = 5(15) + 125 = 75 + 125 = 200$
Step5: Find value difference
$230 - 200 = 30$

Snap & solve any problem in the app
Get step-by-step solutions on Sovi AI
Photo-based solutions with guided steps
Explore more problems and detailed explanations
30 thousand dollars (or 30000 dollars, as a whole number)