QUESTION IMAGE
Question
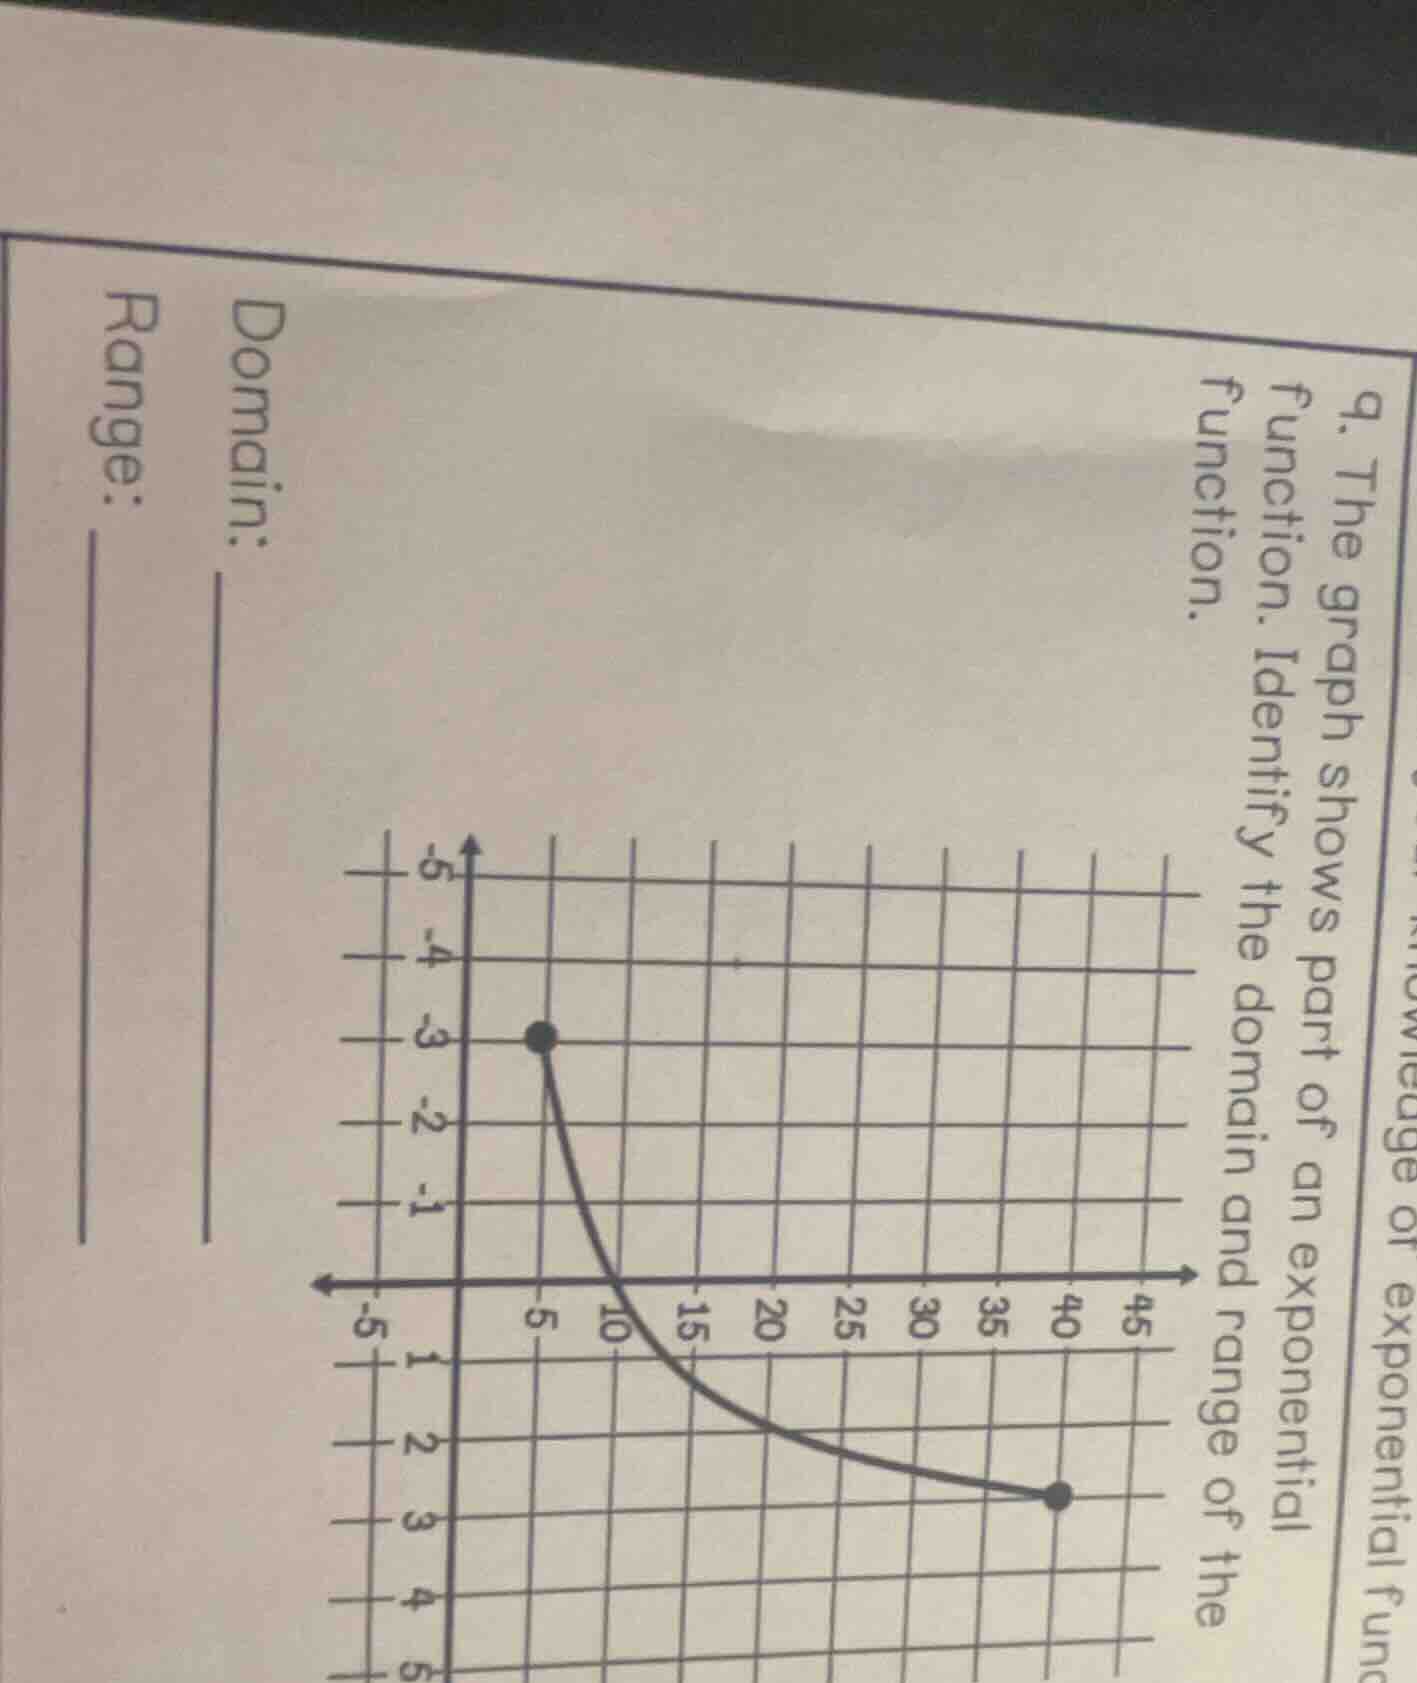
- the graph shows part of an exponential function. identify the domain and range of the function.
domain:
range:
Step1: Determine the domain
The domain of a function is the set of all possible x - values (input values) for which the function is defined. From the graph, we can see that the left - most point has an x - coordinate of 5 and the right - most point has an x - coordinate of 40. Also, since it's a continuous part of the exponential function between these two points, the domain is the set of all real numbers from 5 to 40, inclusive. So, the domain is $5\leq x\leq40$ or in interval notation $[5, 40]$.
Step2: Determine the range
The range of a function is the set of all possible y - values (output values) that the function can take. Looking at the graph, the lowest y - value (at the right - most point) is 3 and the highest y - value (at the left - most point) is - 3? Wait, no, wait. Wait, the y - axis: the left - most point has a y - coordinate of - 3? Wait, no, looking at the graph, the left - most point is at (5, - 3) and the right - most point is at (40, 3)? Wait, no, let's re - examine. Wait, the y - axis: the vertical axis. The left - most dot is at (5, - 3)? Wait, no, the grid: the horizontal axis (x - axis) has values 5, 10, 15,... and the vertical axis (y - axis) has values - 5, - 4, - 3, - 2, - 1, 0, 1, 2, 3, 4, 5. Wait, the left - most point is at (5, - 3) (x = 5, y=-3) and the right - most point is at (40, 3) (x = 40, y = 3)? Wait, no, the curve is from (5, - 3) to (40, 3)? Wait, no, the graph: the left - most dot is at (5, - 3) (since x = 5, y=-3) and the right - most dot is at (40, 3) (x = 40, y = 3). And the function is a curve between them. So the range is the set of all y - values from - 3 to 3, inclusive? Wait, no, wait, the left - most point has y=-3 and the right - most has y = 3, and the function is continuous between them. So the range is $-3\leq y\leq3$ or in interval notation $[-3, 3]$. Wait, no, maybe I got the y - axis wrong. Wait, the vertical axis: the top is - 5, - 4, - 3,... and the bottom is 1, 2, 3,... Wait, no, that can't be. Wait, the y - axis is labeled with - 5 at the top, - 4 below it, - 3 below - 4, then - 2, - 1, 0, then 1, 2, 3, 4, 5 at the bottom? That seems reversed. Wait, maybe the y - axis is drawn with positive values going down? That's an unusual graph, but maybe. So if the left - most point is at (5, - 3) (where - 3 is above 0) and the right - most point is at (40, 3) (where 3 is below 0). But in standard coordinate systems, positive y is up. But maybe in this graph, the y - axis is reversed. Anyway, from the graph, the minimum y - value (the lowest point on the graph) and maximum y - value. Wait, the left - most point has y=-3 (if we take the y - axis as standard, positive up, then - 3 is below 0) and the right - most point has y = 3 (above 0)? No, that doesn't make sense. Wait, maybe I misread the y - axis. Let's look again: the vertical lines (y - axis) have labels - 5, - 4, - 3, - 2, - 1, 0, 1, 2, 3, 4, 5. So the top of the graph is - 5, then going down, we have - 4, - 3, etc., and then 0, 1, 2, 3 at the bottom. So in this case, the left - most point is at (5, - 3) (which is above 0 in this reversed y - axis) and the right - most point is at (40, 3) (which is below 0 in this reversed y - axis). But the range is the set of y - values. So the left - most point has y=-3 and the right - most has y = 3, and the function is between them. So the range is all real numbers from - 3 to 3, inclusive. So the range is $-3\leq y\leq3$ or $[-3, 3]$.

Snap & solve any problem in the app
Get step-by-step solutions on Sovi AI
Photo-based solutions with guided steps
Explore more problems and detailed explanations
Domain: $[5, 40]$ (or $5\leq x\leq40$)
Range: $[-3, 3]$ (or $-3\leq y\leq3$)