QUESTION IMAGE
Question
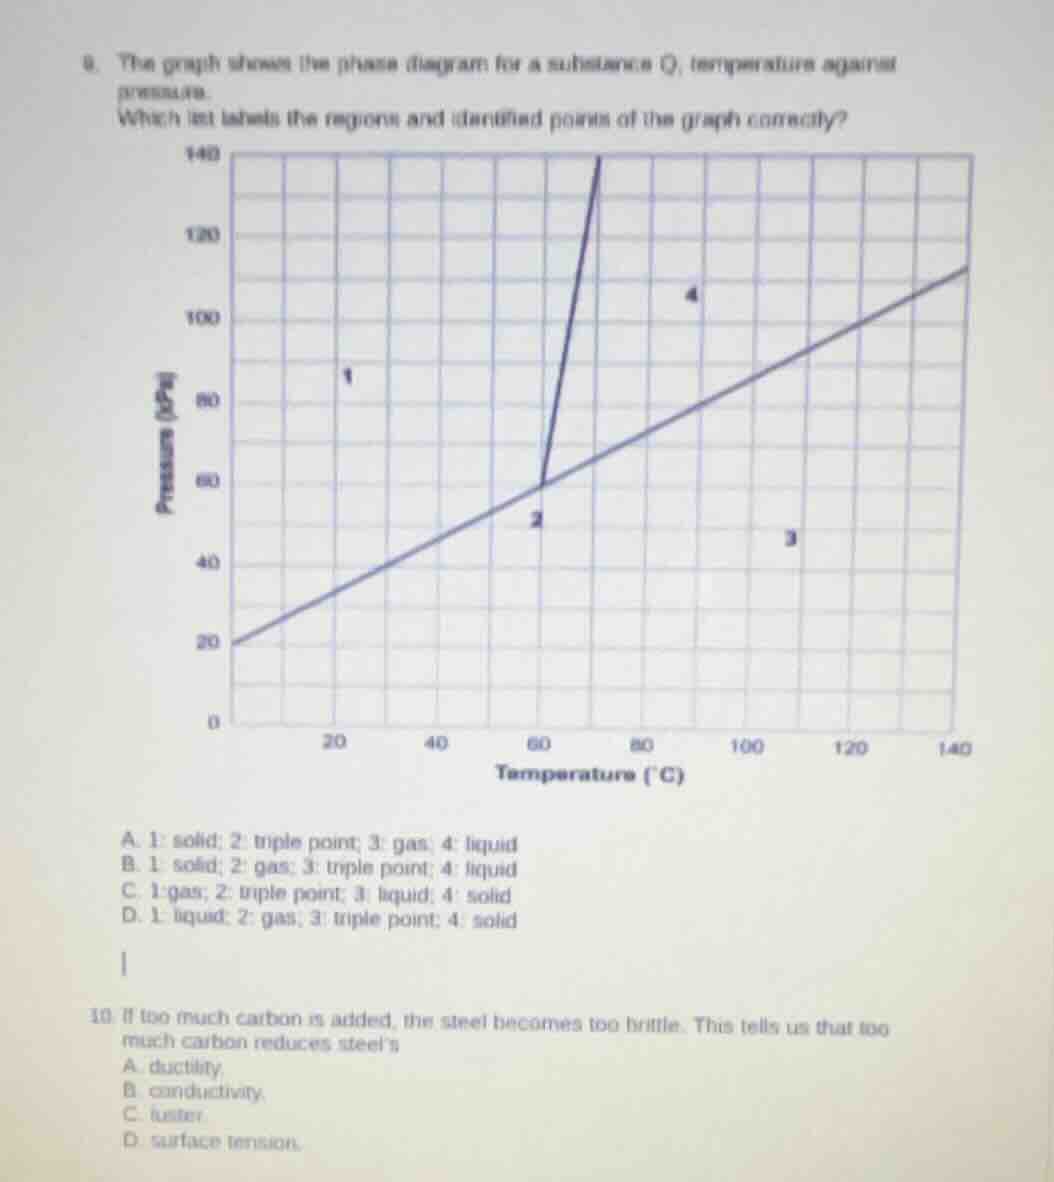
- the graph shows the phase diagram for a substance q, temperature against pressure. which list labels the regions and identified points of the graph correctly?
- if too much carbon is added, the steel becomes too brittle. this tells us that too much carbon reduces steel’s
a. ductility
b. conductivity.
c. luster
d. surface tension.
Question 9
To solve this, we recall phase diagram concepts. A phase diagram shows regions of solid, liquid, gas and the triple point (where all three phases coexist). The lines separate regions: the left - most region (low temp, high pressure) is solid, the region between the two lines (moderate temp and pressure) can be analyzed. The triple point is where the three phase - boundary lines meet. Region 1: low temperature, relatively high pressure, so solid. Point 2: where the lines meet, triple point. Region 3: high temperature, low pressure, so gas. Region 4: moderate - high temperature and pressure, so liquid. So option A (1: solid; 2: triple point; 3: gas; 4: liquid) matches.
Ductility is the ability of a material to be deformed without breaking (like being drawn into wires). Brittleness is the opposite - the material breaks easily. If too much carbon makes steel brittle, it reduces its ductility. Conductivity is about heat/electricity transfer, luster is about shine, surface tension is a liquid property. So the answer is related to ductility.

Snap & solve any problem in the app
Get step-by-step solutions on Sovi AI
Photo-based solutions with guided steps
Explore more problems and detailed explanations
A. 1: solid; 2: triple point; 3: gas; 4: liquid