QUESTION IMAGE
Question
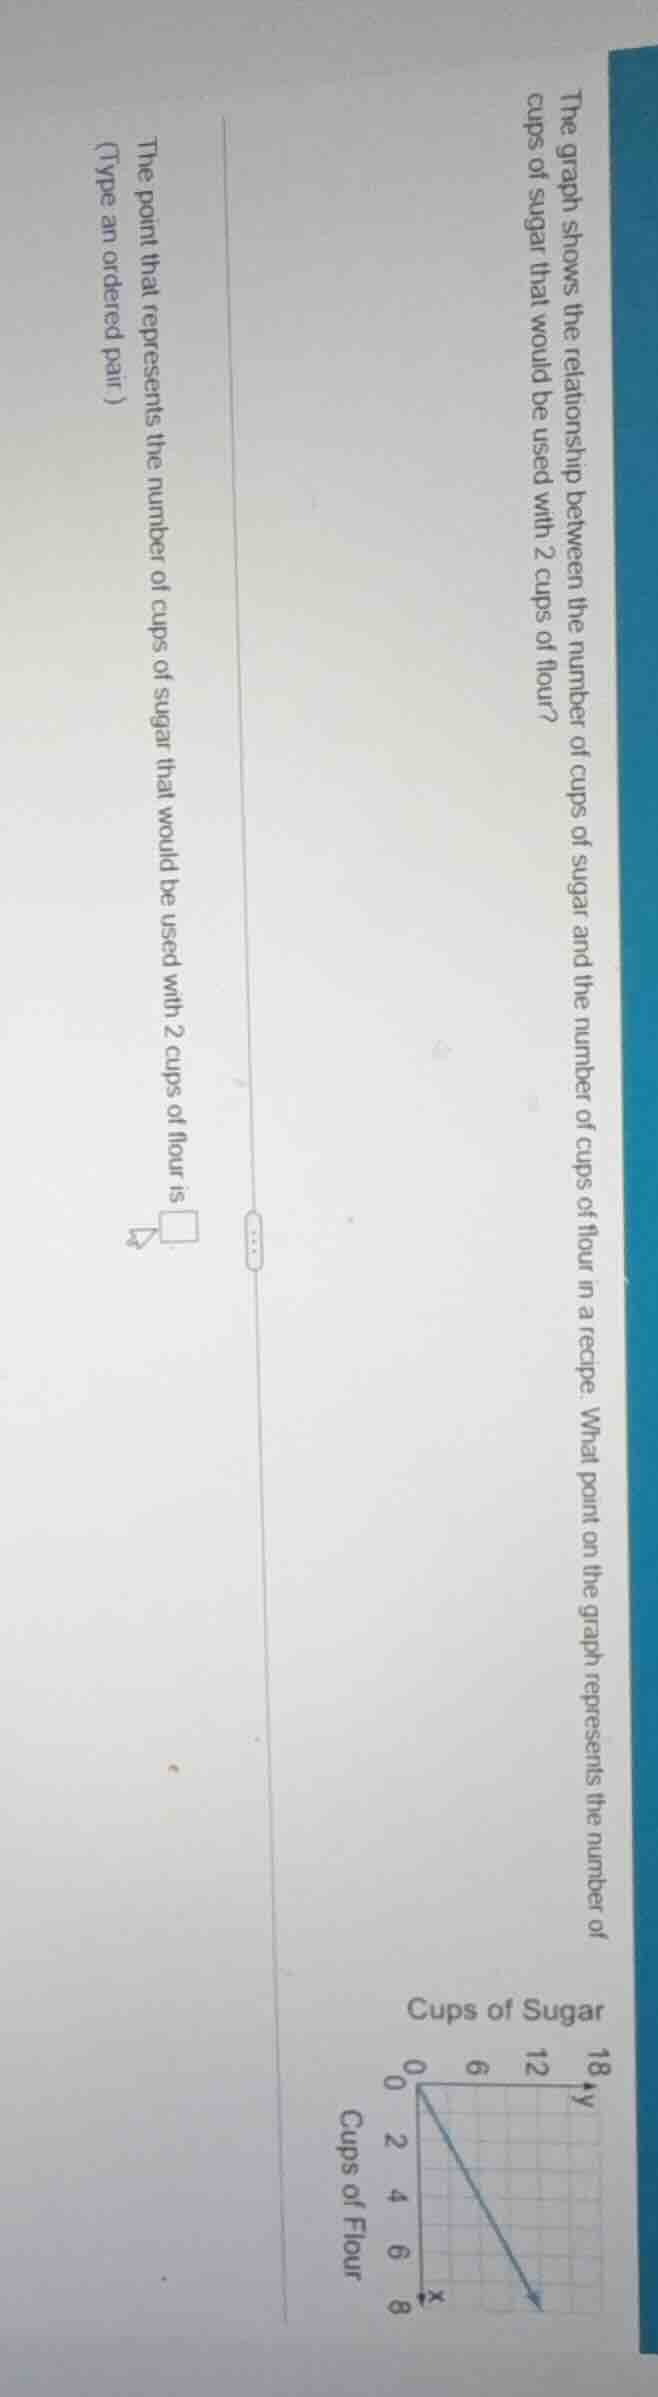
the graph shows the relationship between the number of cups of sugar and the number of cups of flour in a recipe. what point on the graph represents the number of cups of sugar that would be used with 2 cups of flour?
the point that represents the number of cups of sugar that would be used with 2 cups of flour is
(type an ordered pair)
Step1: Identify the axes
The x - axis represents cups of flour, and the y - axis represents cups of sugar.
Step2: Determine the relationship
From the graph, we can see that when the number of cups of flour (x) is 2, we need to find the corresponding number of cups of sugar (y). Looking at the line, when x = 2, y = 6? Wait, no, wait. Wait, let's check the scale. Wait, the x - axis is cups of flour, with marks at 0, 2, 4, 6, 8. The y - axis is cups of sugar with marks at 0, 6, 12, 18. Wait, the line passes through (0,0) and let's see, when x = 6 (cups of flour), y = 18 (cups of sugar)? Wait, no, maybe I got the axes reversed. Wait, the problem says "the relationship between the number of cups of sugar and the number of cups of flour". Wait, the x - axis is labeled "Cups of Flour" and y - axis "Cups of Sugar". Wait, let's find the slope. The slope m is $\frac{y_2 - y_1}{x_2 - x_1}$. Taking two points, say (0,0) and (6, 18)? No, wait, when x = 2 (flour), what's y (sugar)? Wait, maybe the line has a slope. Wait, if we assume the line is linear, let's find the equation. Let's take two points: when x = 0, y = 0. When x = 6 (flour), y = 18 (sugar)? No, that would be slope 3. But wait, when x = 2 (flour), y would be 6? Wait, no, maybe I misread the axes. Wait, the problem says "the point that represents the number of cups of sugar that would be used with 2 cups of flour". So x is flour (2), y is sugar. Looking at the graph, when x = 2 (flour), the corresponding y (sugar) is 6? Wait, no, wait the y - axis is labeled with 0, 6, 12, 18. The x - axis is 0, 2, 4, 6, 8. So when x = 2 (cups of flour), the y - value (cups of sugar) is 6? Wait, no, maybe the line is such that for every 1 cup of flour, 3 cups of sugar? Wait, if x = 2 (flour), then y = 6 (sugar)? Wait, no, let's check the graph again. Wait, the line goes from (0,0) to, say, when x = 6 (flour), y = 18 (sugar)? Then the slope is $\frac{18 - 0}{6 - 0}=3$. So the equation is y = 3x. So when x = 2 (cups of flour), y = 32 = 6? Wait, no, that would mean 2 cups of flour correspond to 6 cups of sugar? Wait, maybe the axes are reversed. Wait, maybe x is sugar and y is flour? No, the labels are clear: x - axis "Cups of Flour", y - axis "Cups of Sugar". Wait, maybe I made a mistake. Wait, let's re - examine. The problem says "the number of cups of sugar that would be used with 2 cups of flour". So flour is x = 2, sugar is y. Looking at the graph, the line passes through (0,0) and when x = 2 (flour), the y (sugar) is 6? Wait, no, the y - axis is marked at 0, 6, 12, 18. So when x = 2 (flour), the point on the line is (2, 6)? Wait, no, maybe the line is such that for 2 cups of flour, the sugar is 6? Wait, but let's check the scale again. Wait, the x - axis (flour) has ticks at 0, 2, 4, 6, 8. The y - axis (sugar) has ticks at 0, 6, 12, 18. So the line is from (0,0) to (6, 18), so the slope is 3. So the equation is y = 3x. So when x = 2 (flour), y = 32 = 6. Wait, but that seems like a lot of sugar. Wait, maybe the axes are reversed. Wait, maybe x is sugar and y is flour? No, the labels are "Cups of Flour" (x) and "Cups of Sugar" (y). So the ordered pair is (x, y)=(2, 6)? Wait, no, wait, maybe I got the slope wrong. Wait, if we take (6, 18) as (flour, sugar), then slope is 18/6 = 3. So y = 3x. So when x = 2, y = 6. So the ordered pair is (2, 6). Wait, but let's confirm. The problem says "the point that represents the number of cups of sugar that would be used with 2 cups of flour". So flour is 2 (x), sugar is y. So the ordered pair is (2, 6).

Snap & solve any problem in the app
Get step-by-step solutions on Sovi AI
Photo-based solutions with guided steps
Explore more problems and detailed explanations
(2, 6)