QUESTION IMAGE
Question
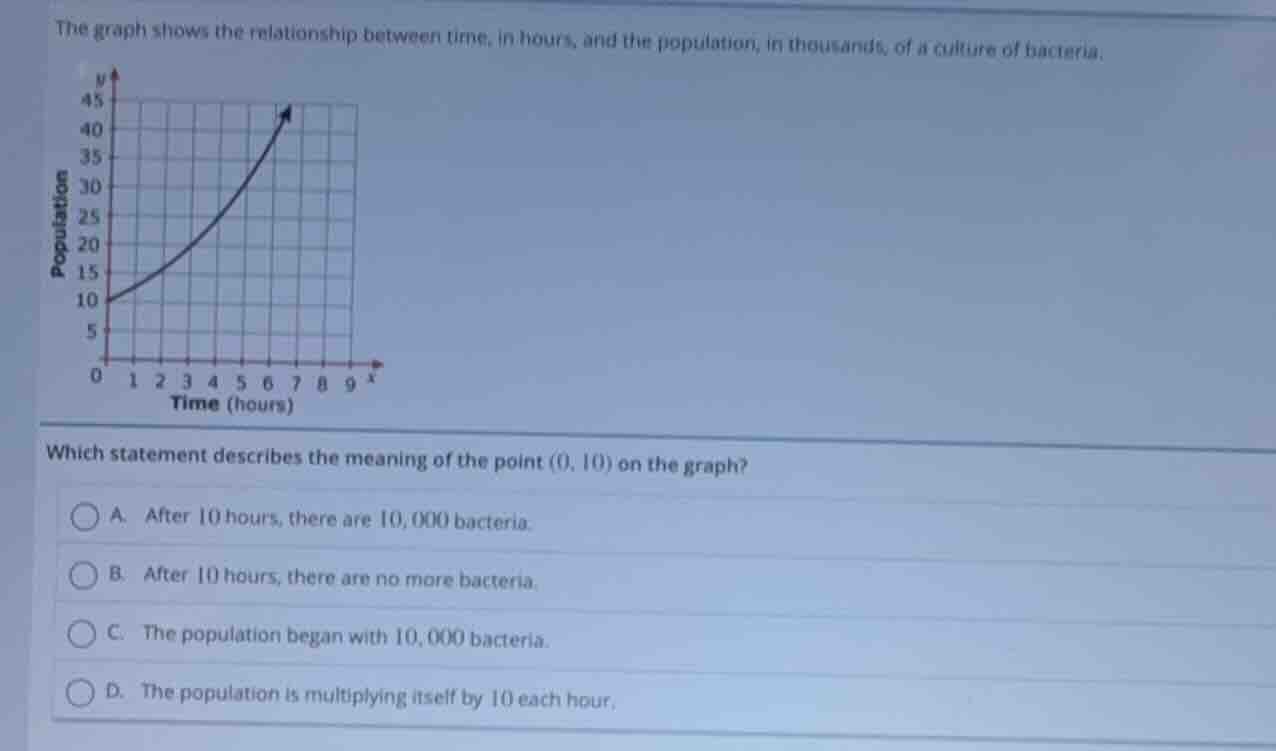
the graph shows the relationship between time, in hours, and the population, in thousands, of a culture of bacteria.
which statement describes the meaning of the point (0, 10) on the graph?
a. after 10 hours, there are 10,000 bacteria.
b. after 10 hours, there are no more bacteria.
c. the population began with 10,000 bacteria.
d. the population is multiplying itself by 10 each hour.
The x-axis represents time in hours, and the y-axis represents population in thousands. The point (0, 10) means at 0 hours (the start time), the population is 10 thousand, or 10,000 bacteria. We can eliminate other options: A refers to 10 hours, not 0; B is incorrect as the value is 10,000 not 0; D describes exponential growth, not the meaning of this specific point.

Snap & solve any problem in the app
Get step-by-step solutions on Sovi AI
Photo-based solutions with guided steps
Explore more problems and detailed explanations
C. The population began with 10,000 bacteria.