QUESTION IMAGE
Question
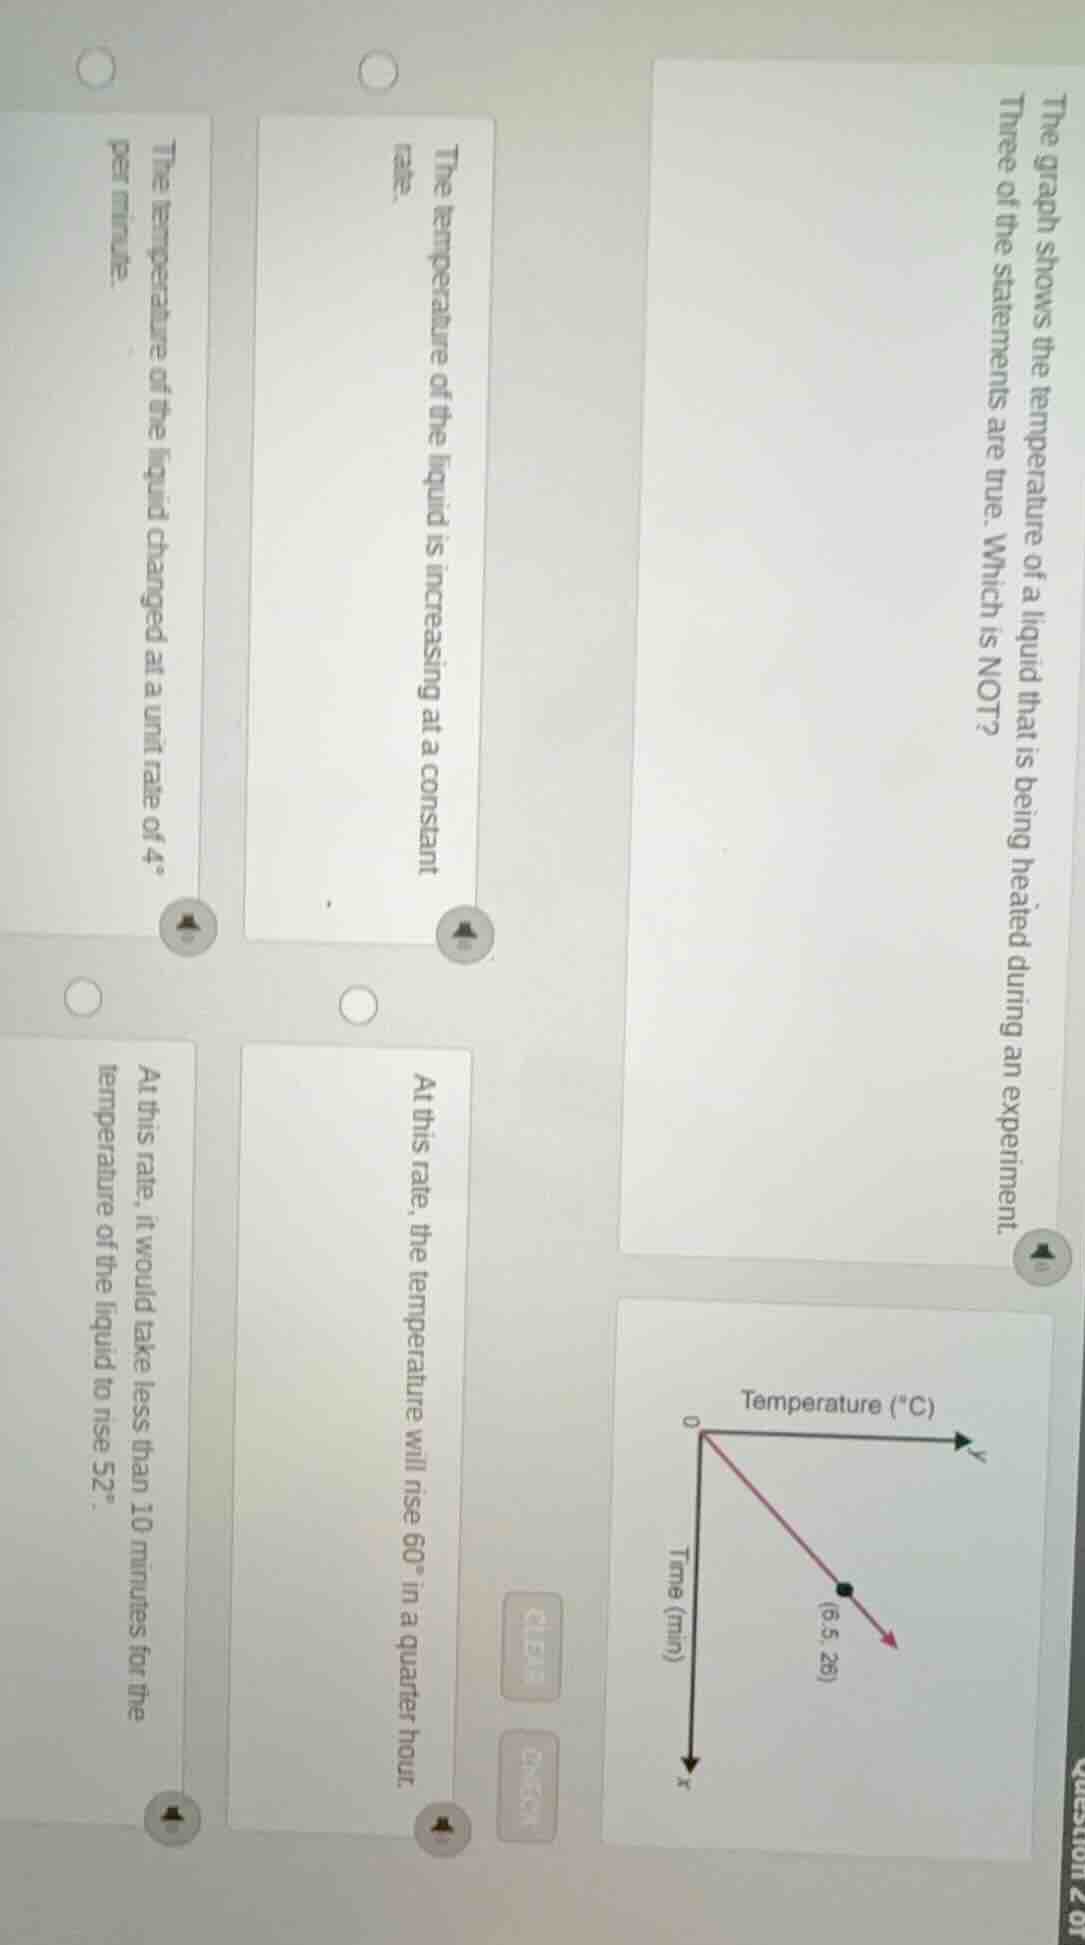
the graph shows the temperature of a liquid that is being heated during an experiment. three of the statements are true. which is not?
the temperature of the liquid is increasing at a constant rate.
the temperature of the liquid changed at a unit rate of 4° per minute.
at this rate, the temperature will rise 60° in a quarter hour.
at this rate, it would take less than 10 minutes for the temperature of the liquid to rise 52°.
Step1: Calculate rate of temperature change
The rate is $\frac{\text{Temperature change}}{\text{Time change}} = \frac{26}{6.5} = 4^\circ\text{C per minute}$
Step2: Verify constant rate claim
The graph is a straight line, so the rate is constant.
Step3: Check 15-minute temperature rise
In 15 minutes, rise is $4 \times 15 = 60^\circ\text{C}$.
Step4: Check time for 52° rise
Time needed is $\frac{52}{4} = 13$ minutes, which is more than 10.

Snap & solve any problem in the app
Get step-by-step solutions on Sovi AI
Photo-based solutions with guided steps
Explore more problems and detailed explanations
At this rate, it would take less than 10 minutes for the temperature of the liquid to rise 52°.