QUESTION IMAGE
Question
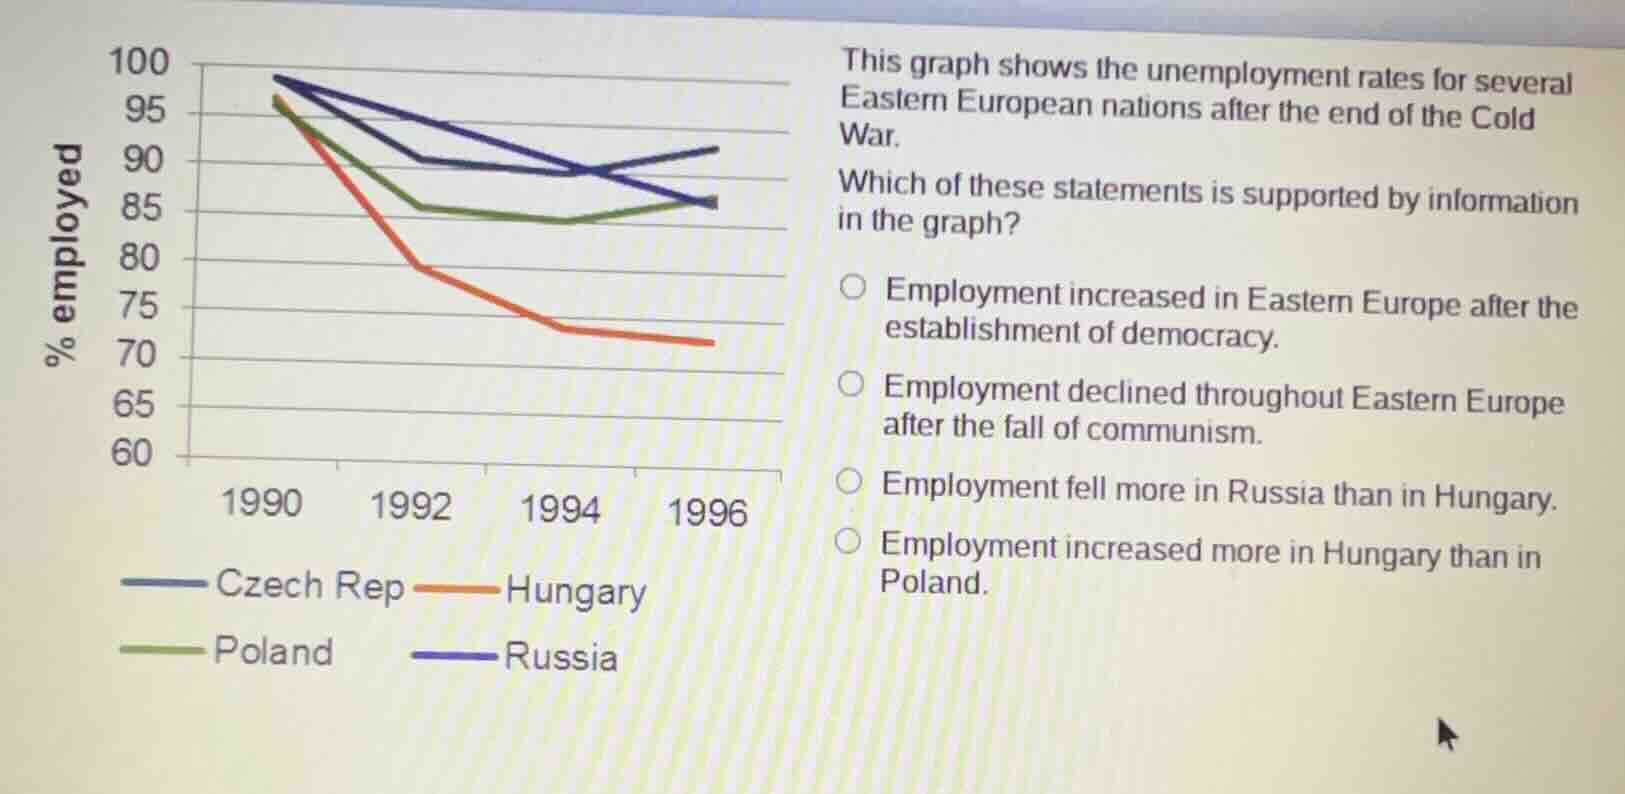
this graph shows the unemployment rates for several eastern european nations after the end of the cold war. which of these statements is supported by information in the graph? employment increased in eastern europe after the establishment of democracy. employment declined throughout eastern europe after the fall of communism. employment fell more in russia than in hungary. employment increased more in hungary than in poland.
Brief Explanations
- Analyze each option:
- Option 1: The graph shows employment (as % employed) generally decreasing, not increasing, so this is incorrect.
- Option 2: Looking at the lines for Czech Rep, Hungary, Poland, and Russia from 1990 (after Cold War/fall of communism) to 1996, all show a downward trend in % employed (or at least not increasing overall), so this is supported.
- Option 3: Hungary's line (red) drops more from 1990 to 1996 than Russia's (dark blue), so this is incorrect.
- Option 4: Poland's line (green) has a relatively small change or slight decrease, while Hungary's (red) drops significantly, so employment did not increase more in Hungary than Poland (and both mostly decreased), so this is incorrect.

Snap & solve any problem in the app
Get step-by-step solutions on Sovi AI
Photo-based solutions with guided steps
Explore more problems and detailed explanations
B. Employment declined throughout Eastern Europe after the fall of communism.