QUESTION IMAGE
Question
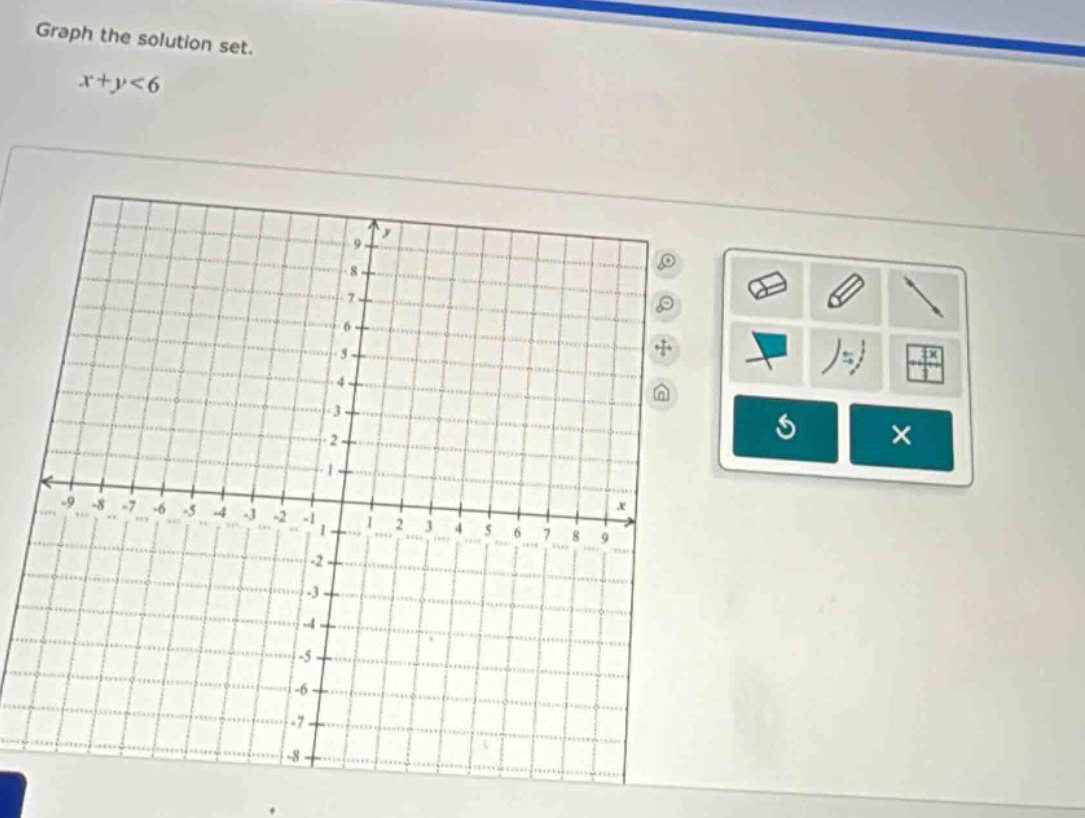
graph the solution set.
$x + y < 6$
Step1: Rewrite the inequality
First, rewrite the inequality \(x + y < 6\) in slope - intercept form (\(y=mx + b\)) by solving for \(y\). Subtract \(x\) from both sides: \(y<-x + 6\).
Step2: Graph the boundary line
The boundary line for the inequality \(y=-x + 6\) is a straight line. Since the inequality is \(y < -x+6\) (not \(y\leq -x + 6\)), we use a dashed line. To find two points on the line \(y=-x + 6\):
- When \(x = 0\), \(y=6\), so the point is \((0,6)\).
- When \(x = 6\), \(y=-6 + 6=0\), so the point is \((6,0)\). Plot these two points and draw a dashed line through them.
Step3: Shade the solution region
To determine which side of the line to shade, we can use a test point. A common test point is \((0,0)\) (as long as it is not on the boundary line). Substitute \(x = 0\) and \(y = 0\) into the inequality \(y<-x + 6\):
\(0<-(0)+6\), which simplifies to \(0 < 6\). This is a true statement. So we shade the region that contains the point \((0,0)\), which is the region below the dashed line \(y=-x + 6\).
(Note: Since this is a graphing problem, the final answer is the graph with the dashed line \(y=-x + 6\) and the region below the line shaded. If we were to describe the steps for graphing, the above steps outline the process. If you are using a graphing tool, you would first plot the dashed line through \((0,6)\) and \((6,0)\) and then shade the area below the line.)

Snap & solve any problem in the app
Get step-by-step solutions on Sovi AI
Photo-based solutions with guided steps
Explore more problems and detailed explanations
The solution set is graphed by first drawing the dashed line \(y=-x + 6\) (through points \((0,6)\) and \((6,0)\)) and then shading the region below this dashed line.