QUESTION IMAGE
Question
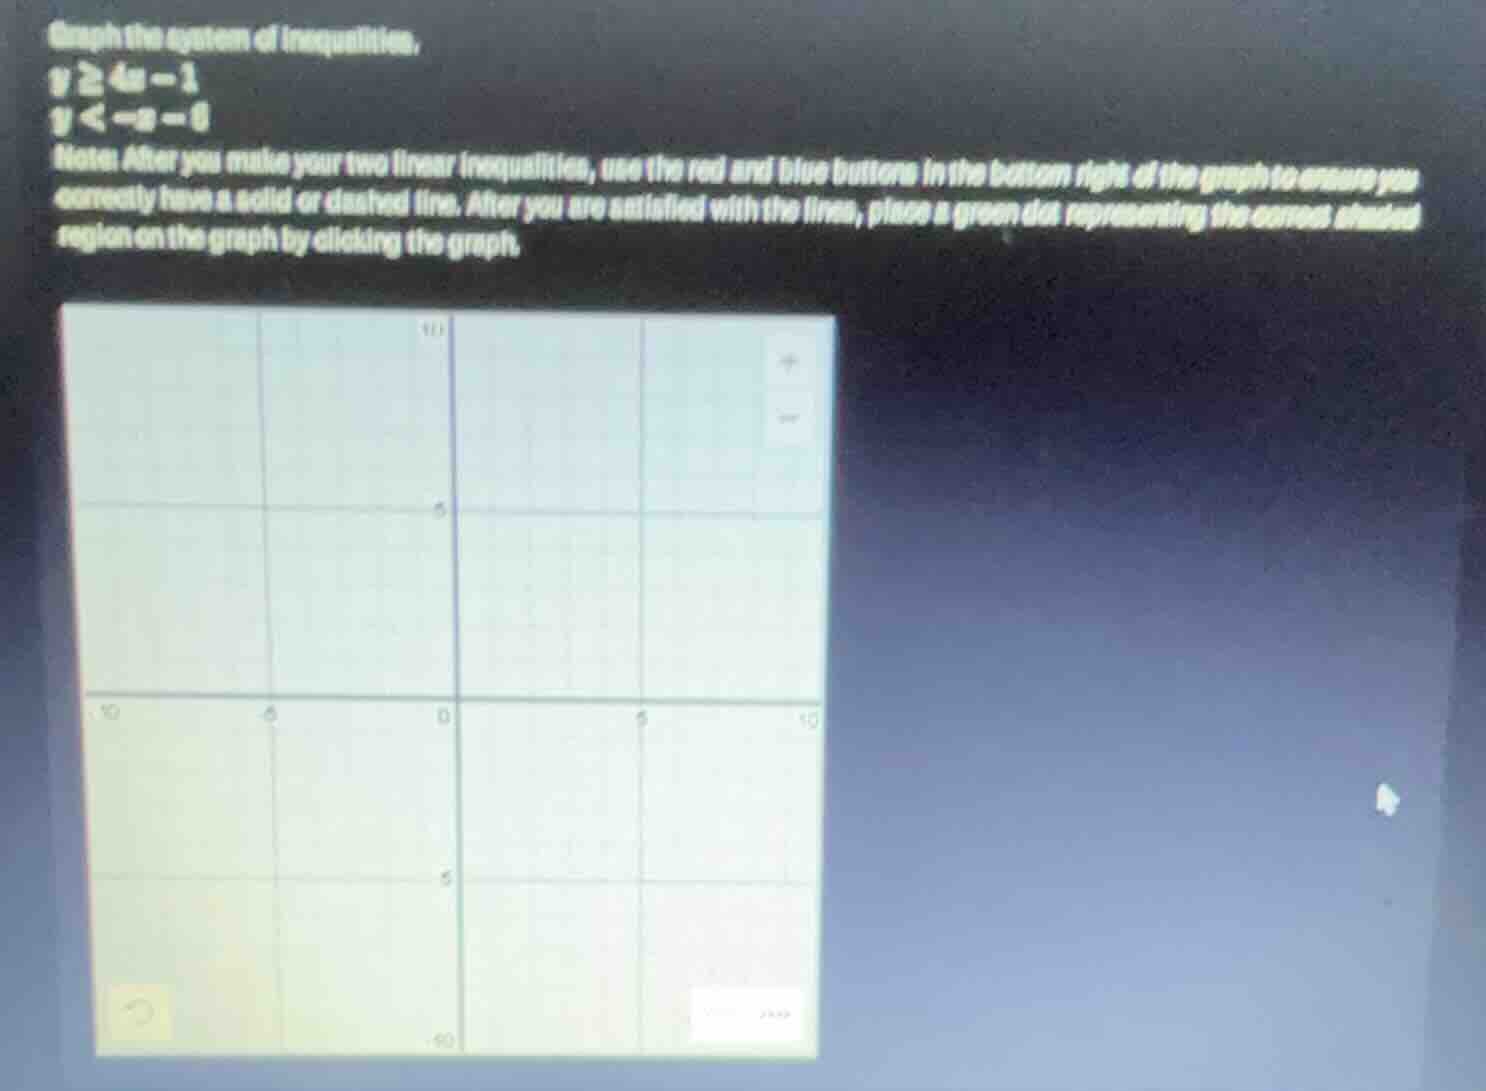
graph the system of inequalities,
y ≥ 4x - 1
y < -x - 6
note: after you make your two linear inequalities, use the red and blue buttons in the bottom right of the graph to ensure you correctly have a solid or dashed line. after you are satisfied with the lines, place a green dot representing the correct shaded region on the graph by clicking the graph.
Step1: Graph boundary line 1
First, graph the line $y=4x-1$. Since the inequality is $y\geq4x-1$, use a solid line (because the inequality includes equality). To plot, find intercepts: when $x=0$, $y=-1$; when $y=0$, $x=\frac{1}{4}$.
Step2: Shade region for first inequality
Shade the area above the solid line $y=4x-1$ (since $y$ is greater than or equal to the line's values).
Step3: Graph boundary line 2
Next, graph the line $y=-x-6$. Since the inequality is $y<-x-6$, use a dashed line (because the inequality does not include equality). To plot, find intercepts: when $x=0$, $y=-6$; when $y=0$, $x=-6$.
Step4: Shade region for second inequality
Shade the area below the dashed line $y=-x-6$ (since $y$ is less than the line's values).
Step5: Identify overlapping region
The solution is the overlapping shaded area of the two regions. A sample point in this region is $(-5, -3)$ (it satisfies both inequalities: $-3\geq4(-5)-1=-21$ and $-3<-(-5)-6=-1$). Place the green dot in this overlapping area.

Snap & solve any problem in the app
Get step-by-step solutions on Sovi AI
Photo-based solutions with guided steps
Explore more problems and detailed explanations
- Solid line for $y=4x-1$, shaded above the line.
- Dashed line for $y=-x-6$, shaded below the line.
- Green dot placed in the overlapping shaded region (e.g., at $(-5, -3)$).