QUESTION IMAGE
Question
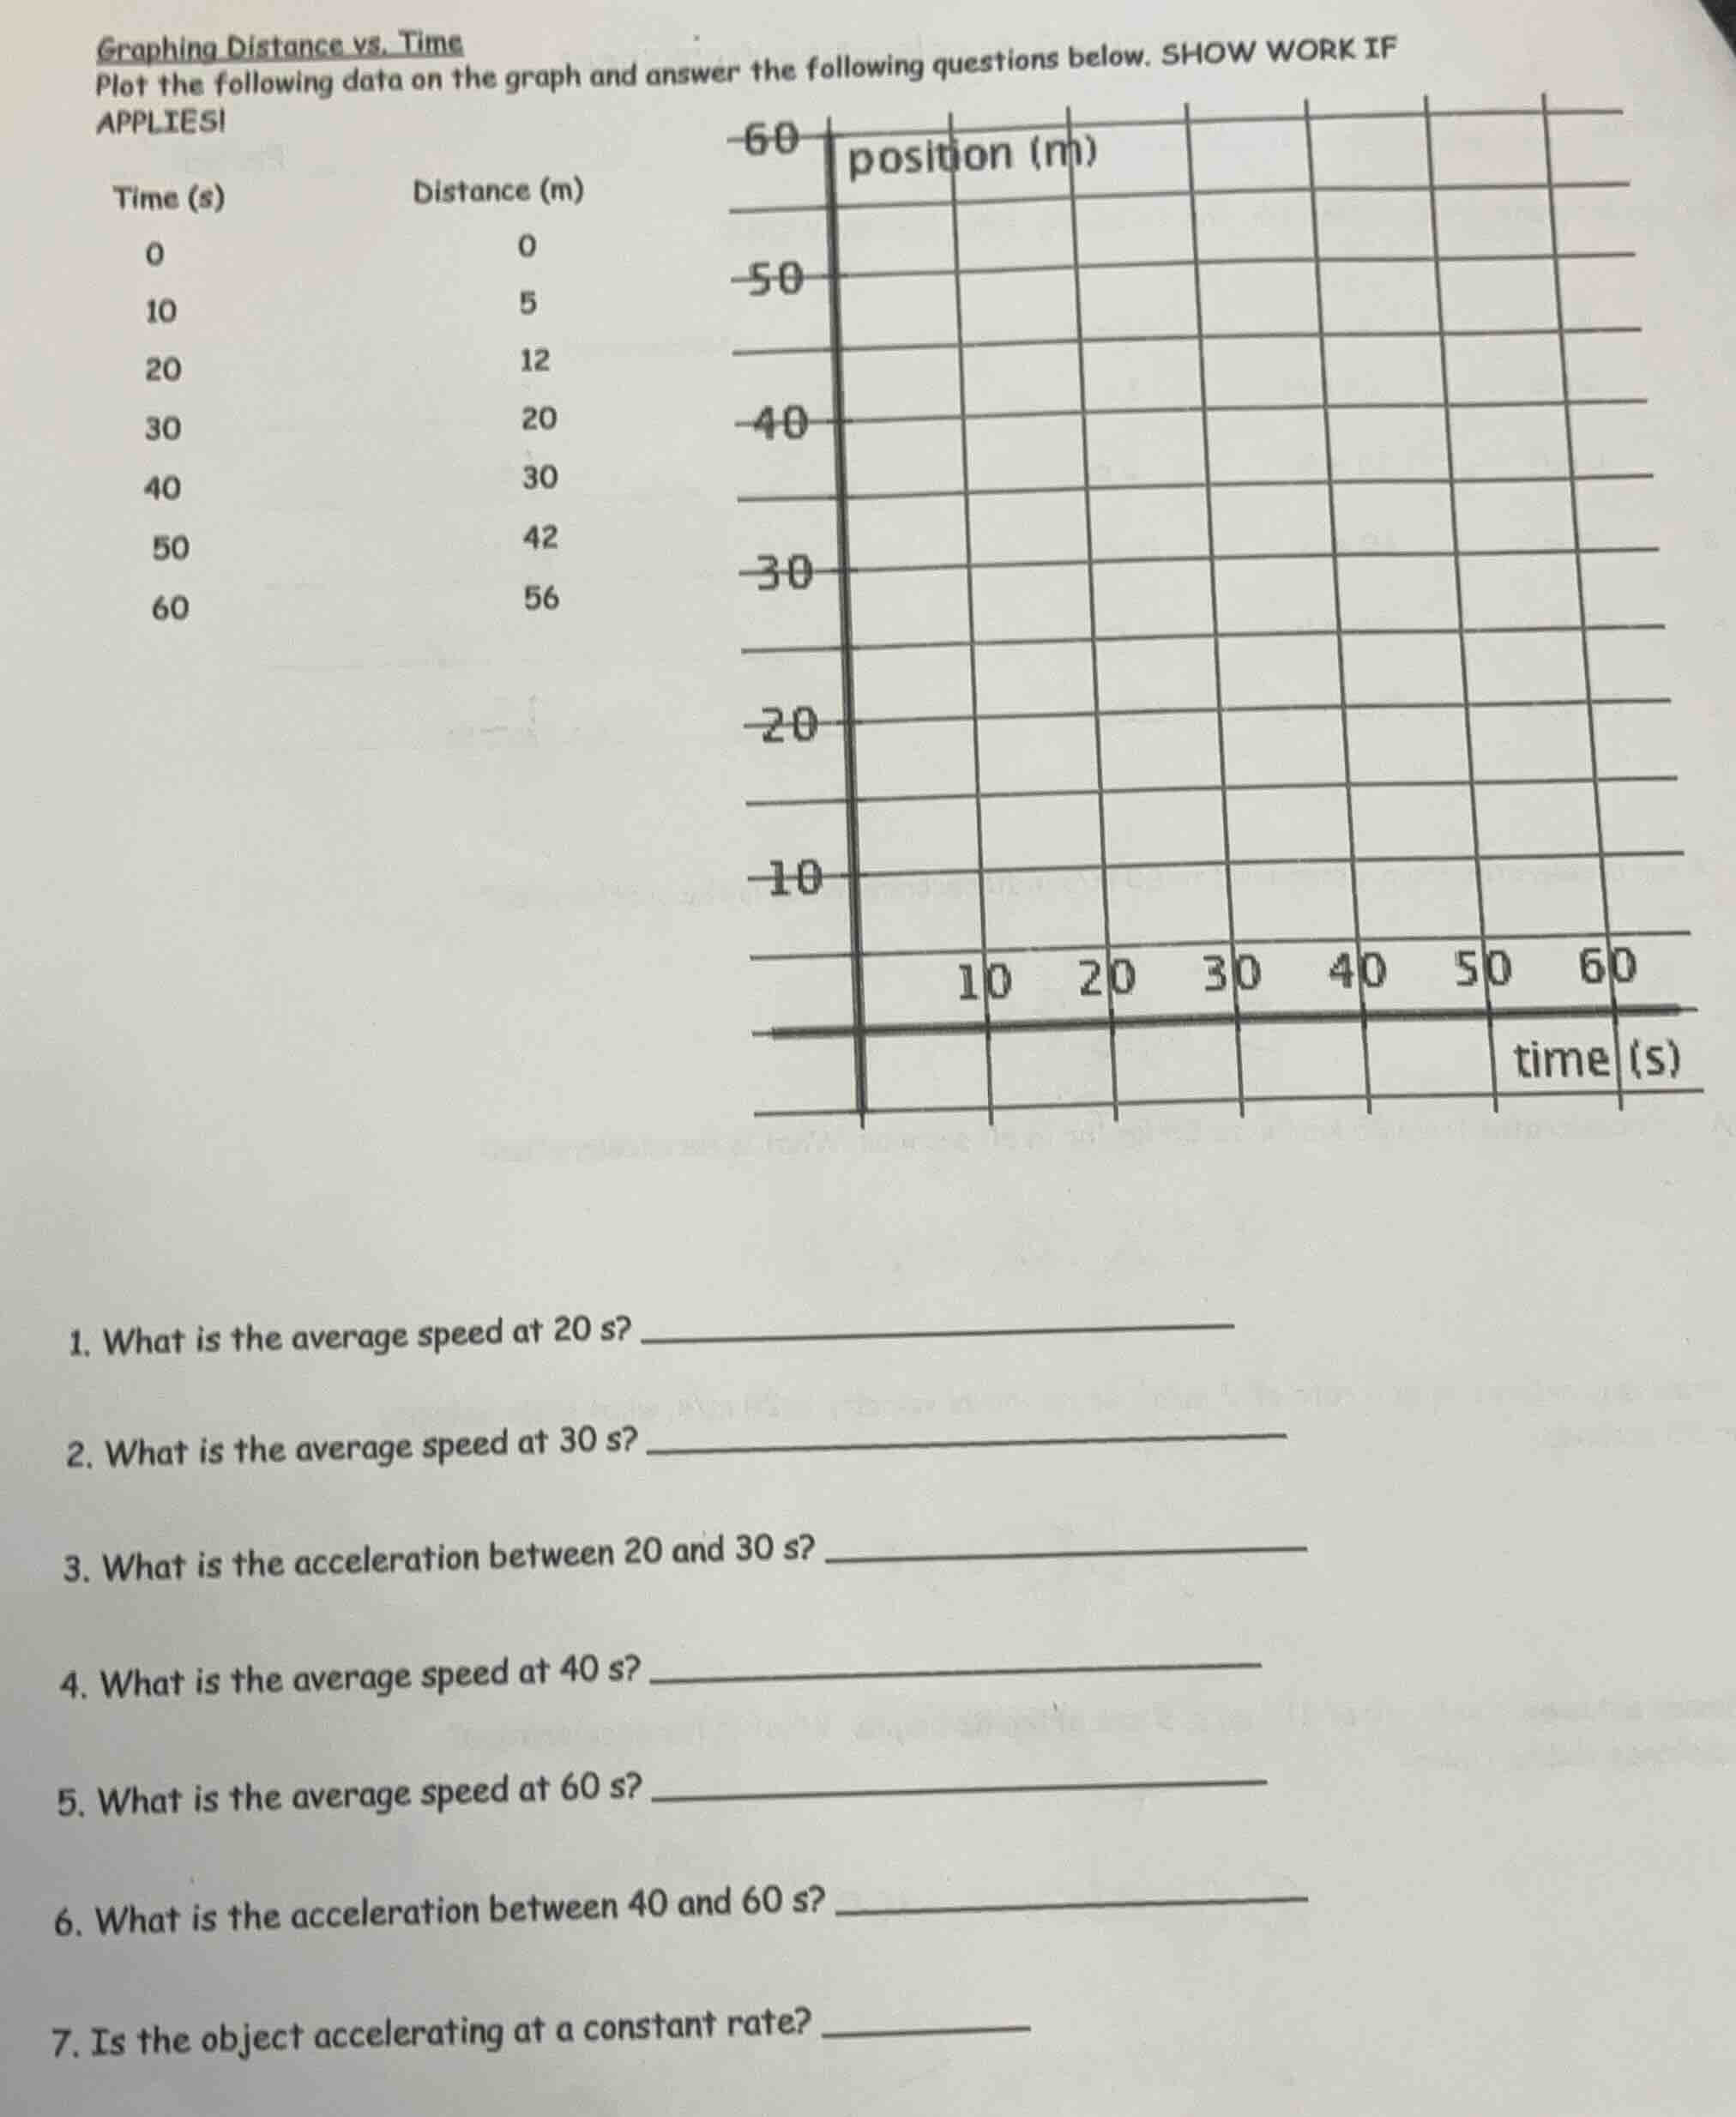
graphing distance vs. time
plot the following data on the graph and answer the following questions below. show work if applies!
time (s)\tdistance (m)
0\t0
10\t5
20\t12
30\t20
40\t30
50\t42
60\t56
- what is the average speed at 20 s?
- what is the average speed at 30 s?
- what is the acceleration between 20 and 30 s?
- what is the average speed at 40 s?
- what is the average speed at 60 s?
- what is the acceleration between 40 and 60 s?
- is the object accelerating at a constant rate?
Step1: Avg speed at 20s: use $v=\frac{d}{t}$
$\text{Average Speed} = \frac{12\ \text{m}}{20\ \text{s}} = 0.6\ \text{m/s}$
Step2: Avg speed at 30s: use $v=\frac{d}{t}$
$\text{Average Speed} = \frac{20\ \text{m}}{30\ \text{s}} \approx 0.67\ \text{m/s}$
Step3: Accel 20-30s: find $\Delta v/\Delta t$
First, find speed at 20s: $v_{20}=0.6\ \text{m/s}$, speed at 30s: $v_{30}\approx0.67\ \text{m/s}$
$\text{Acceleration} = \frac{0.67\ \text{m/s} - 0.6\ \text{m/s}}{30\ \text{s}-20\ \text{s}} = 0.007\ \text{m/s}^2$
Step4: Avg speed at 40s: use $v=\frac{d}{t}$
$\text{Average Speed} = \frac{30\ \text{m}}{40\ \text{s}} = 0.75\ \text{m/s}$
Step5: Avg speed at 60s: use $v=\frac{d}{t}$
$\text{Average Speed} = \frac{56\ \text{m}}{60\ \text{s}} \approx 0.93\ \text{m/s}$
Step6: Accel 40-60s: find $\Delta v/\Delta t$
Speed at 40s: $v_{40}=0.75\ \text{m/s}$, speed at 60s: $v_{60}\approx0.93\ \text{m/s}$
$\text{Acceleration} = \frac{0.93\ \text{m/s} - 0.75\ \text{m/s}}{60\ \text{s}-40\ \text{s}} = 0.009\ \text{m/s}^2$
Step7: Compare acceleration values
Acceleration 20-30s ($0.007\ \text{m/s}^2$) ≠ 40-60s ($0.009\ \text{m/s}^2$)

Snap & solve any problem in the app
Get step-by-step solutions on Sovi AI
Photo-based solutions with guided steps
Explore more problems and detailed explanations
- $0.6\ \text{m/s}$
- $\approx0.67\ \text{m/s}$
- $0.007\ \text{m/s}^2$
- $0.75\ \text{m/s}$
- $\approx0.93\ \text{m/s}$
- $0.009\ \text{m/s}^2$
- No