QUESTION IMAGE
Question
graphing inequalities with positive rational numbers
home unit overview
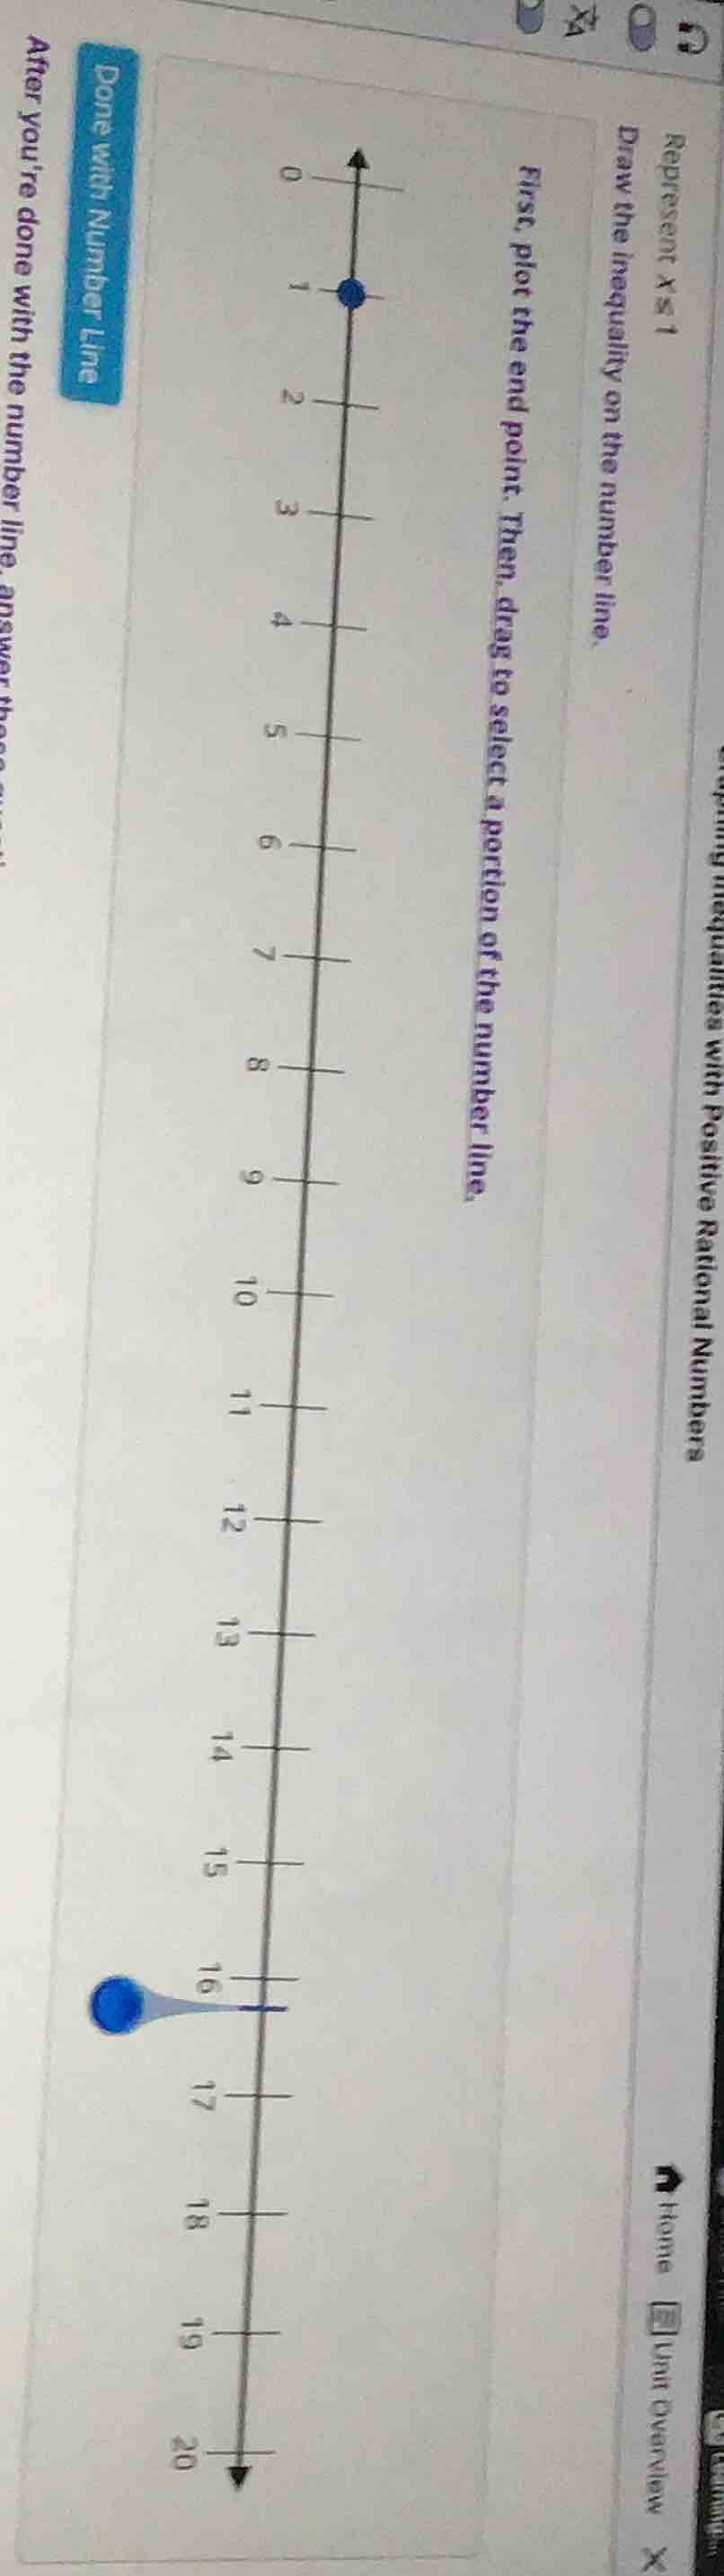
represent $x \leq 1$
draw the inequality on the number line.
first, plot the end point. then, drag to select a portion of the number line.
done with number line
after youre done with the number line, answer these quest
Step1: Identify endpoint of inequality
The inequality $x \leq 1$ includes the value $1$, so we use a closed (filled) dot at $x=1$ (this is already plotted correctly on the number line).
Step2: Select the correct portion
Since $x$ is less than or equal to $1$, we shade all values on the number line to the left of $1$ (towards negative infinity, along the direction of the arrow pointing left from $0$).

Snap & solve any problem in the app
Get step-by-step solutions on Sovi AI
Photo-based solutions with guided steps
Explore more problems and detailed explanations
A closed dot at $x=1$, with all values to the left of $1$ shaded on the number line.