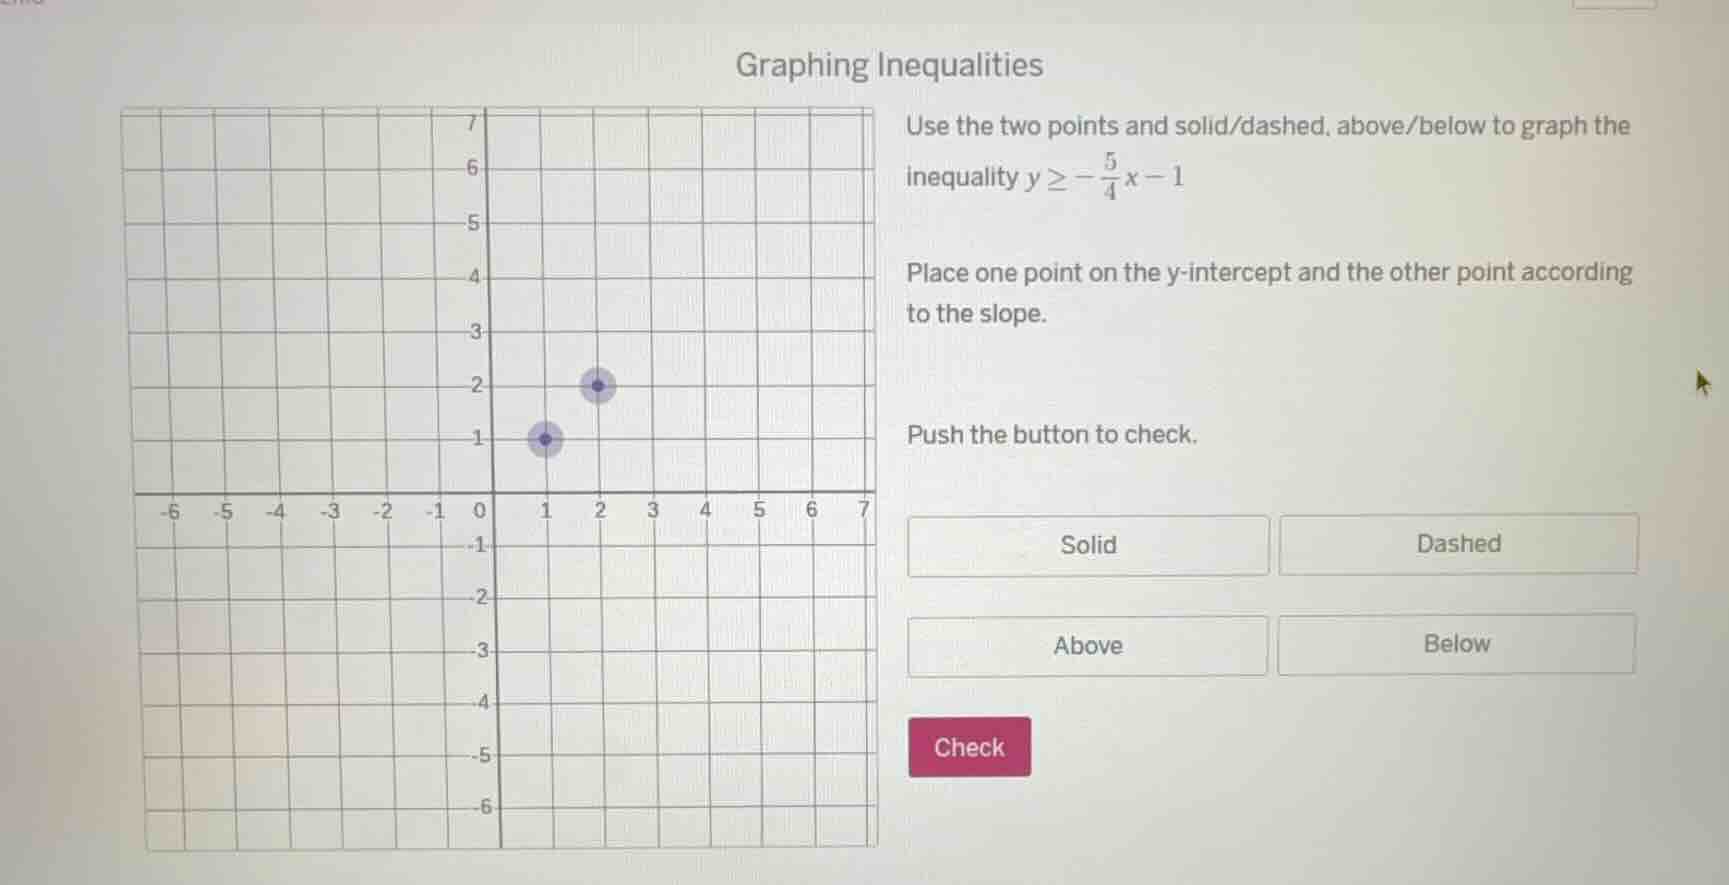
QUESTION IMAGE
Question
graphing inequalities
use the two points and solid/dashed, above/below to graph the
inequality $y \geq -\frac{5}{4}x - 1$
place one point on the y-intercept and the other point according
to the slope.
push the button to check.
solid dashed
above below
check
Step1: Analyze the inequality form
The inequality is \( y \geq -\frac{5}{4}x - 1 \). The general form of a linear inequality is \( y \geq mx + b \) (or other inequality signs), where \( m \) is the slope and \( b \) is the y - intercept. Here, \( b=-1 \), so the y - intercept is at \( (0, - 1) \). The slope \( m =-\frac{5}{4}\), which means for every 4 units we move to the right (increase in x by 4), we move down 5 units (decrease in y by 5), or for every 4 units we move to the left (decrease in x by 4), we move up 5 units (increase in y by 5).
Step2: Determine the line type (solid/dashed)
Since the inequality is \( y\geq-\frac{5}{4}x - 1 \) (the "greater than or equal to" sign), the line should be solid. This is because the "or equal to" part means that the points on the line \( y =-\frac{5}{4}x - 1 \) are included in the solution set.
Step3: Determine the region (above/below)
For a linear inequality of the form \( y\geq mx + b \), the solution region is above the line \( y = mx + b \). To understand this, we can think of testing a point not on the line, say \( (0,0) \). Substitute \( x = 0 \) and \( y = 0 \) into the inequality: \( 0\geq-\frac{5}{4}(0)-1\), which simplifies to \( 0\geq - 1 \), a true statement. The point \( (0,0) \) is above the line \( y=-\frac{5}{4}x - 1 \) (since at \( x = 0 \), the line is at \( y=-1 \) and \( 0>-1 \)), so the region above the line is the solution region.
Step4: Plot the points
- The y - intercept is at \( (0,-1) \), so we place a point at \( (0, - 1) \).
- Using the slope \( -\frac{5}{4} \), starting from the y - intercept \( (0,-1) \), if we move 4 units to the right (to \( x = 4 \)) and 5 units down (since the slope is negative), we get to the point \( (4,-1 - 5)=(4,-6) \), or if we move 4 units to the left (to \( x=-4 \)) and 5 units up, we get to the point \( (-4,-1 + 5)=(-4,4) \).
- After plotting the two points and drawing the solid line through them, we shade the region above the line.

Snap & solve any problem in the app
Get step-by-step solutions on Sovi AI
Photo-based solutions with guided steps
Explore more problems and detailed explanations
- Line type: Solid
- Region: Above
- Points: One point at \( (0, - 1) \) (y - intercept) and another point (e.g., \( (4,-6) \) or \( (-4,4) \)) plotted according to the slope, with the solid line drawn through them and the region above the line shaded.