QUESTION IMAGE
Question
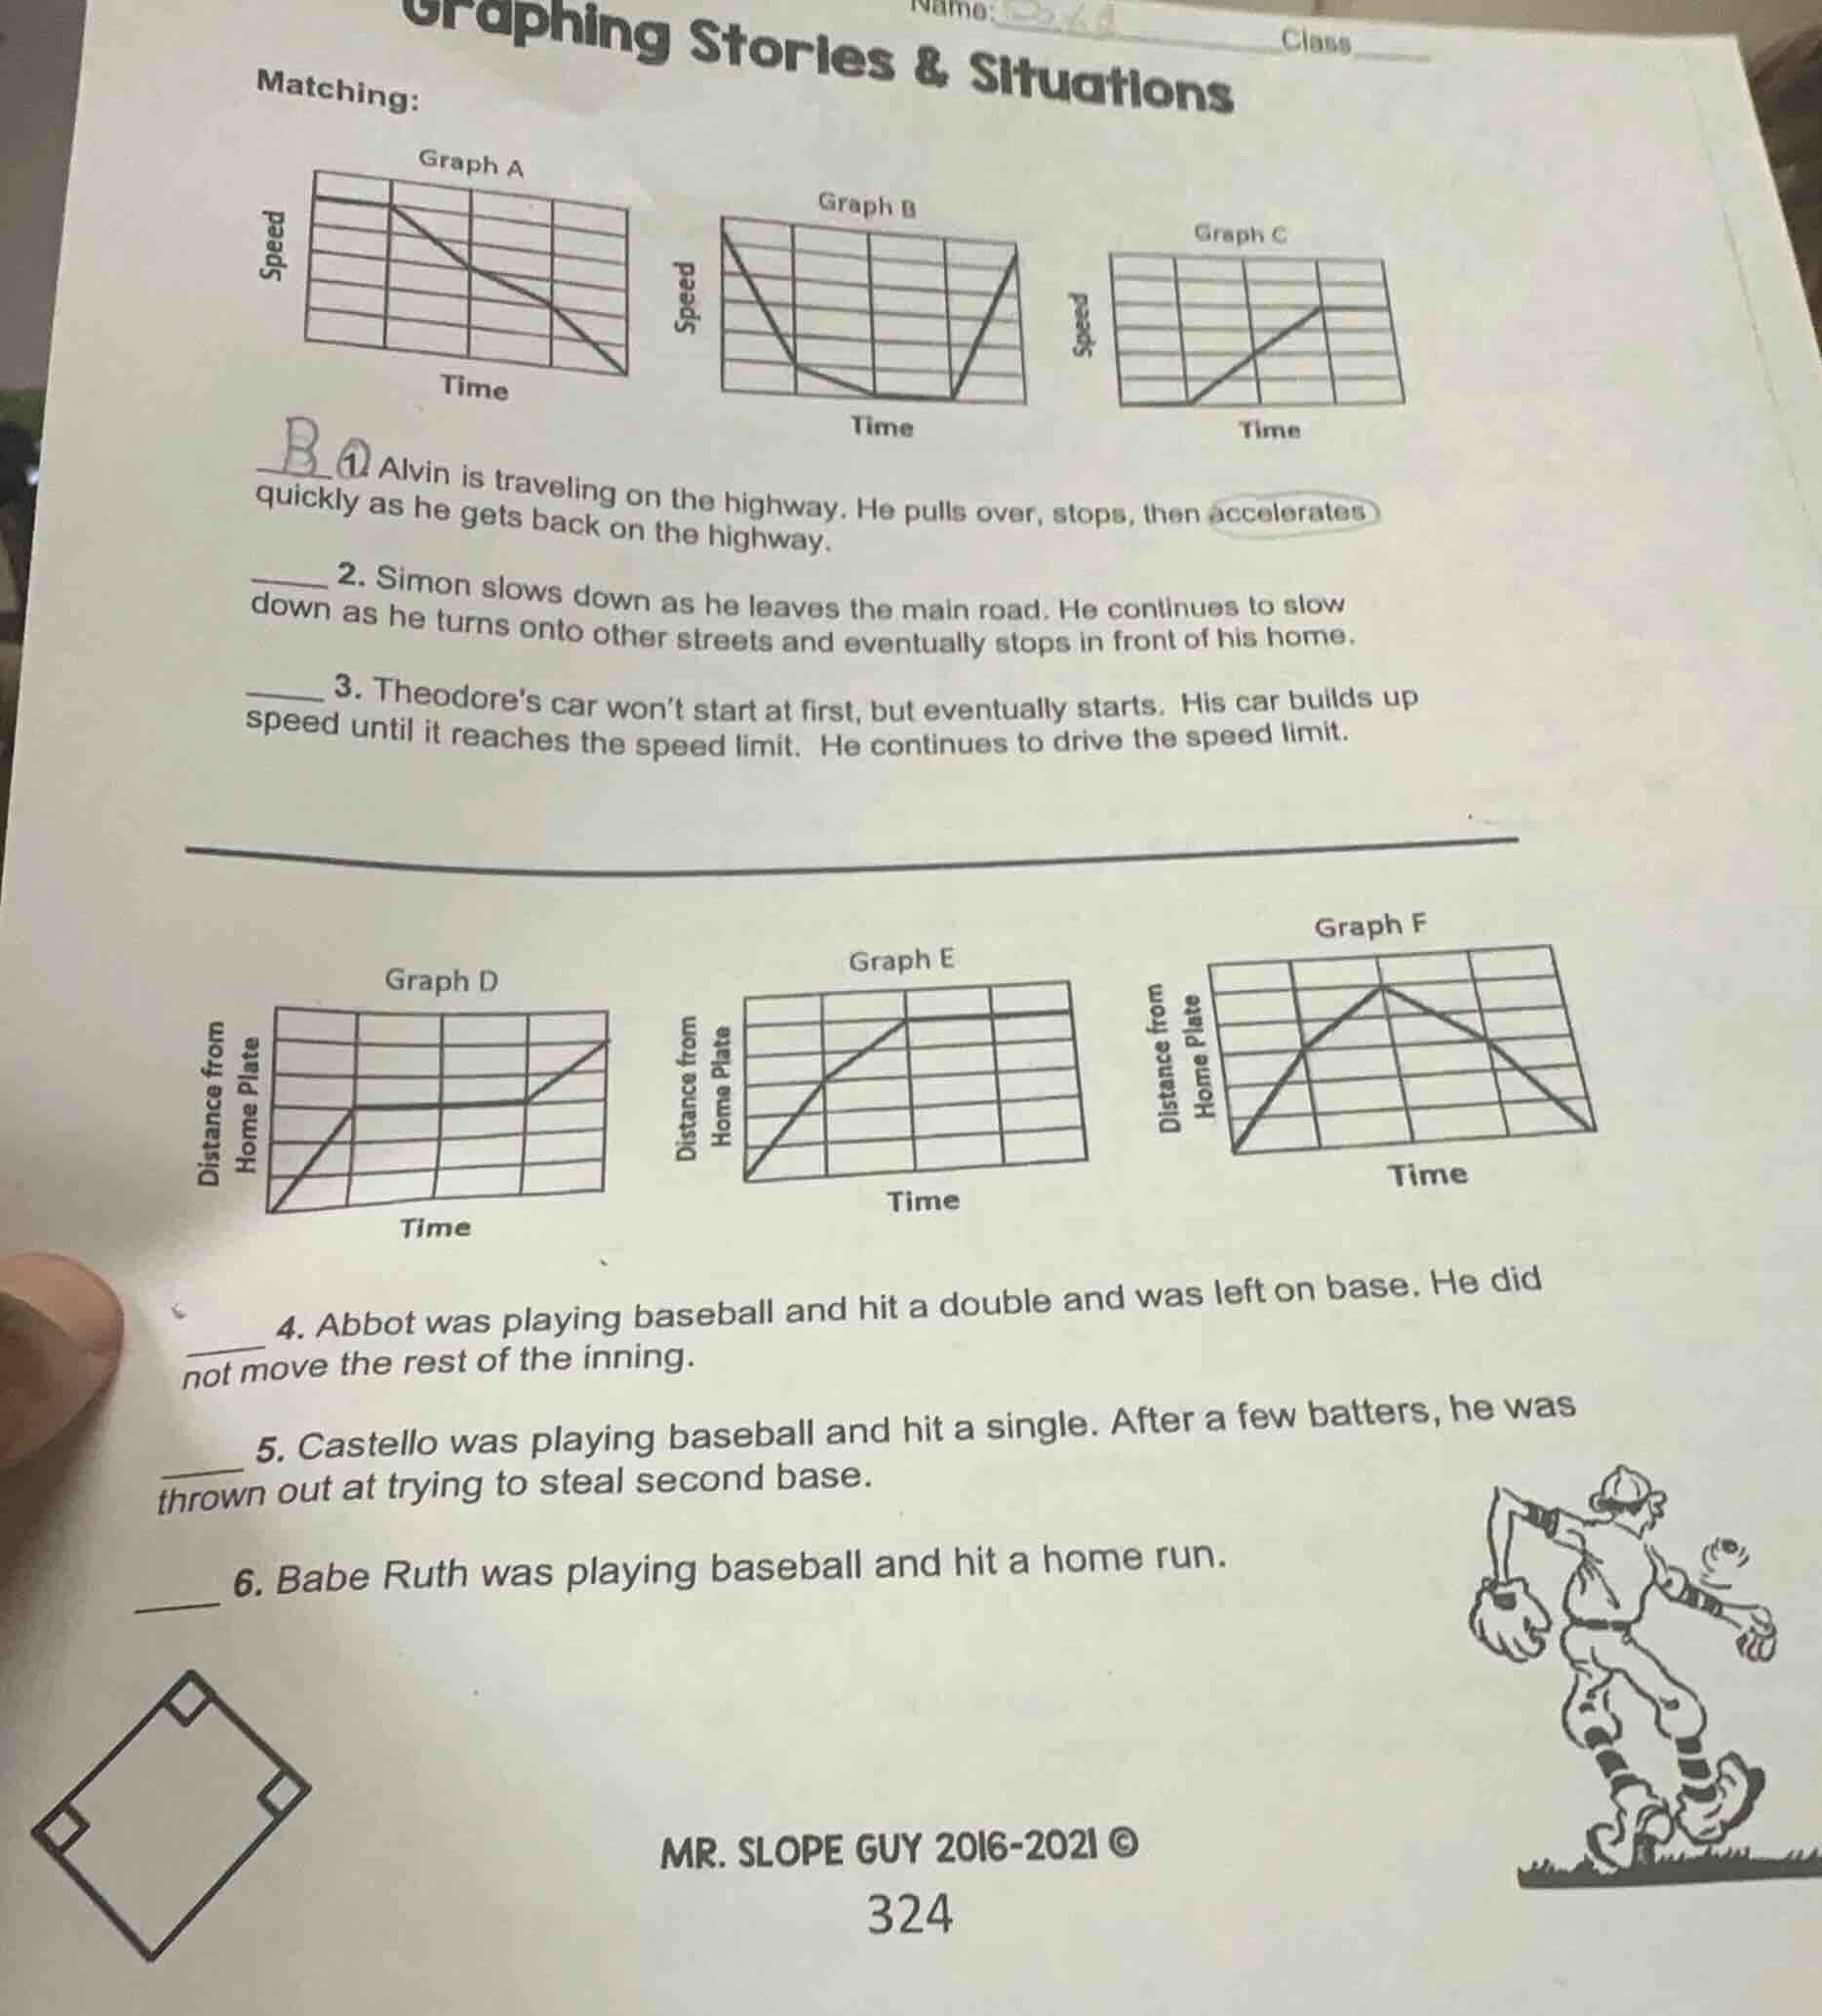
graphing stories & situations
matching:
graph a (speed vs time), graph b (speed vs time), graph c (speed vs time)
- alvin is traveling on the highway. he pulls over, stops, then accelerates quickly as he gets back on the highway.
- simon slows down as he leaves the main road. he continues to slow down as he turns onto other streets and eventually stops in front of his home.
- theodores car wont start at first, but eventually starts. his car builds up speed until it reaches the speed limit. he continues to drive the speed limit.
graph d (distance from home plate vs time), graph e (distance from home plate vs time), graph f (distance from home plate vs time)
- abbot was playing baseball and hit a double and was left on base. he did not move the rest of the inning.
- castello was playing baseball and hit a single. after a few batters, he was thrown out at trying to steal second base.
- babe ruth was playing baseball and hit a home run.
mr. slope guy 2016-2021 ©
324
Question 2
Step1: Analyze Simon's motion
Simon slows down continuously until he stops. So the speed - time graph should show a continuous decrease in speed over time until speed reaches 0. Graph A has a line that is decreasing (sloping downwards) and ends at speed 0, which matches Simon's situation of slowing down and eventually stopping.
Step2: Confirm the match
By comparing the description of Simon's motion (slowing down, then more slowing down, then stopping) with the graphs, Graph A's speed - time curve (decreasing slope to zero speed) is the best fit.
Step1: Analyze Theodore's motion
Theodore's car starts (speed from 0), then builds up speed (speed increasing) until it reaches the speed limit, then drives at a constant speed (speed remains constant). Graph C has a segment where speed is 0 initially, then increases (sloping upwards), then becomes constant (horizontal line), which matches Theodore's situation.
Step2: Confirm the match
Looking at the graphs, Graph C's speed - time graph has the pattern of starting from 0, increasing speed, then constant speed, so it matches Theodore's motion.
Step1: Analyze Abbot's motion
Abbot hits a double and then doesn't move. So the distance from home plate should increase (when he hits the double) and then remain constant (since he doesn't move). Graph D has a segment where distance increases, then becomes constant (horizontal line), which matches Abbot's situation.
Step2: Confirm the match
Comparing with the distance - time graphs, Graph D's pattern of increasing distance then constant distance fits Abbot's motion (hits double, then stays on base).

Snap & solve any problem in the app
Get step-by-step solutions on Sovi AI
Photo-based solutions with guided steps
Explore more problems and detailed explanations
A