QUESTION IMAGE
Question
the great golden coqui extinction
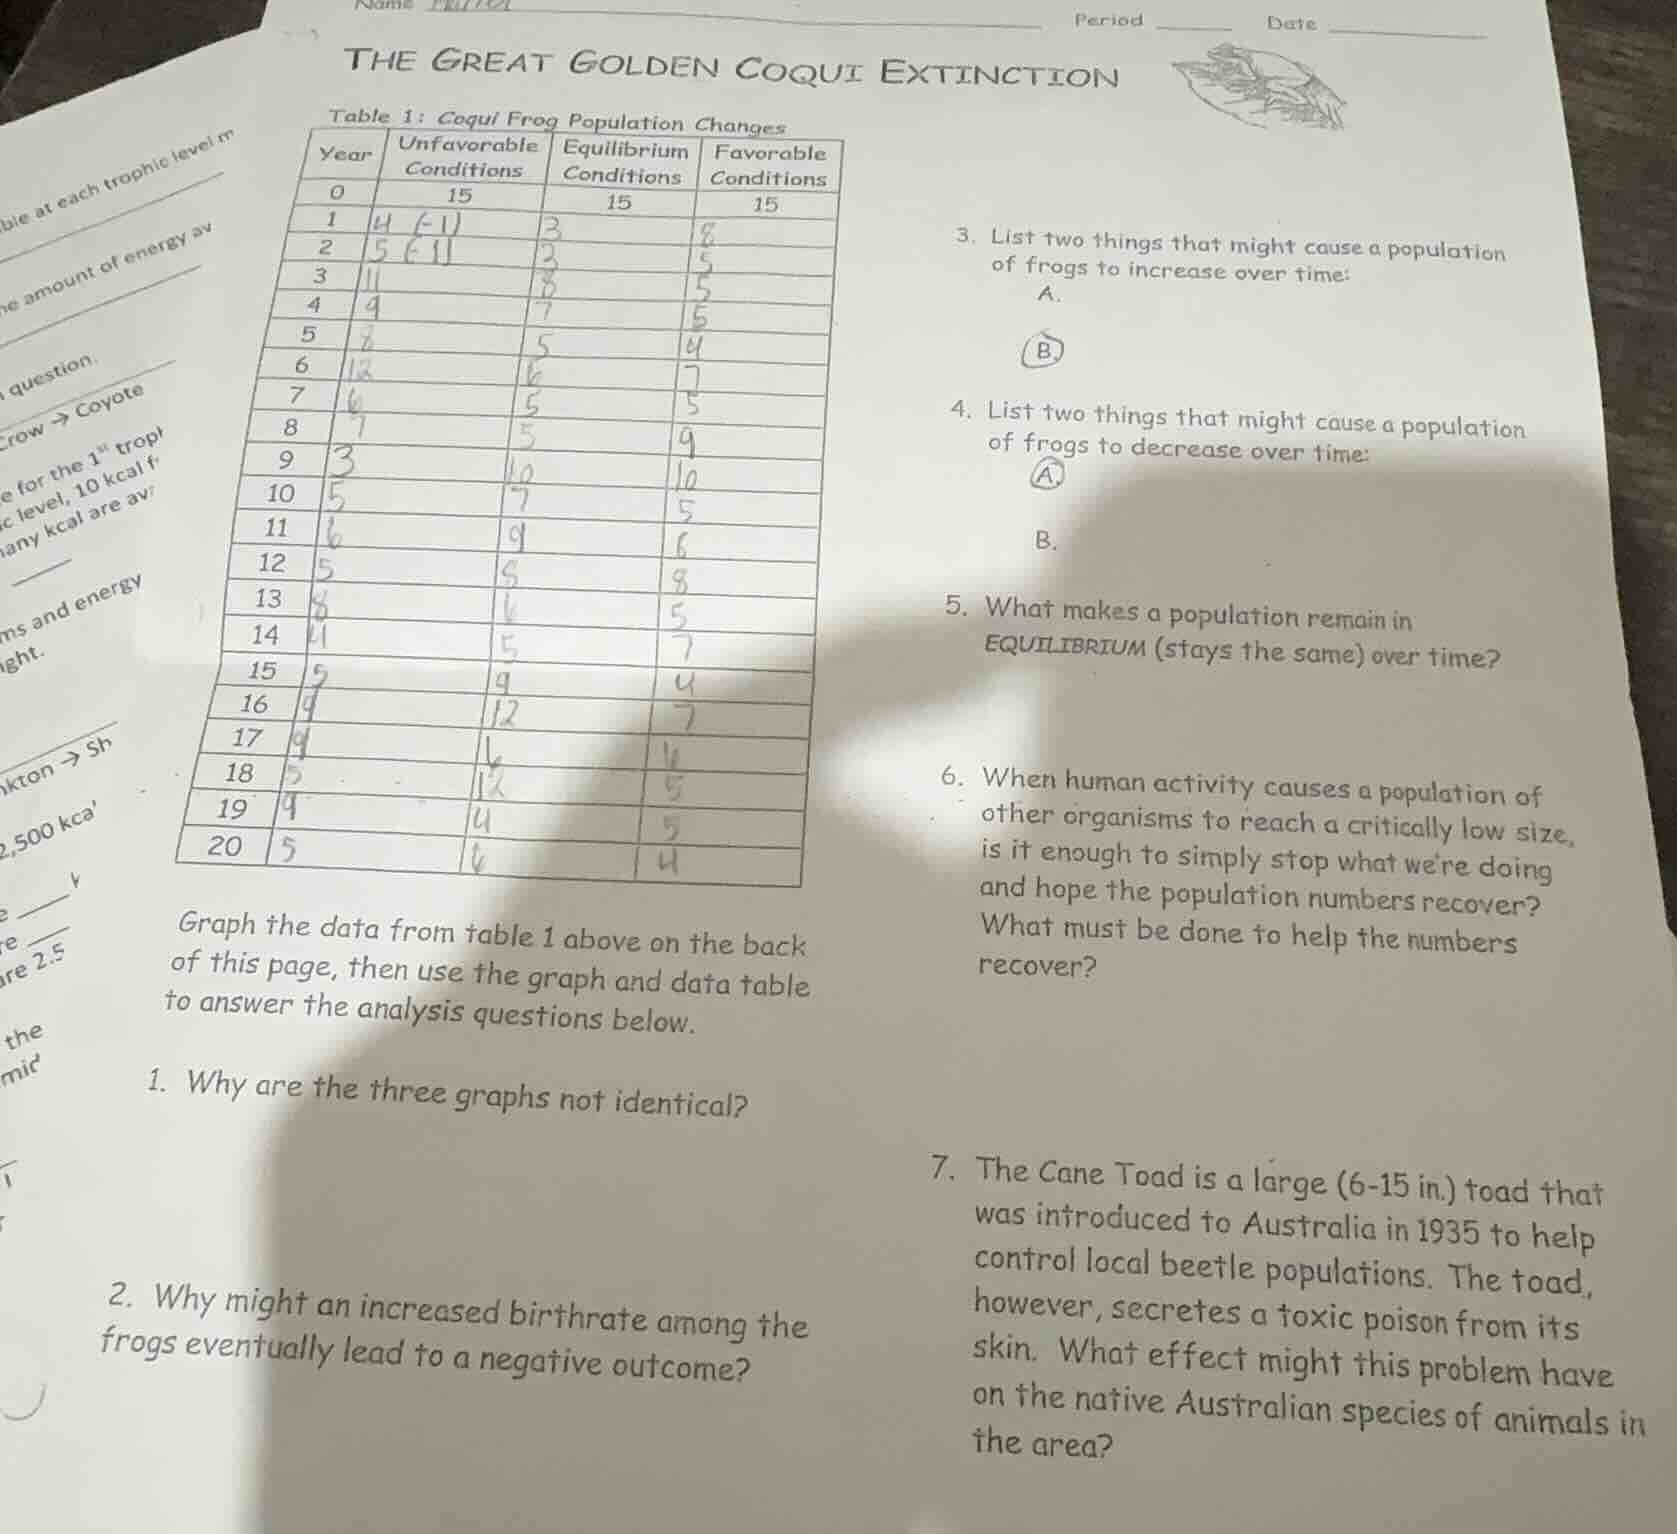
table 1: coqui frog population changes
year unfavorable conditions equilibrium conditions favorable conditions
0 15 15 15
1 4 (-1) 3 8
2 5 (-1) 3 5
3 11 8 5
4 9 7 5
5 2 5 4
6 12 6 7
7 9 5 5
8 7 5 9
9 3 10 10
10 5 7 5
11 6 9 6
12 5 5 8
13 8 6 5
14 1 5 7
15 5 9 4
16 9 12 7
17 9 1 4
18 5 12 5
19 9 4 5
20 5 6 4
graph the data from table 1 above on the back of this page, then use the graph and data table to answer the analysis questions below.
- why are the three graphs not identical?
- why might an increased birthrate among the frogs eventually lead to a negative outcome?
- list two things that might cause a population of frogs to increase over time:
a.
b.
- list two things that might cause a population of frogs to decrease over time:
a.
b.
- what makes a population remain in equilibrium (stays the same) over time?
- when human activity causes a population of other organisms to reach a critically low size, is it enough to simply stop what were doing and hope the population numbers recover? what must be done to help the numbers recover?
- the cane toad is a large (6-15 in.) toad that was introduced to australia in 1935 to help control local beetle populations. the toad, however, secretes a toxic poison from its skin. what effect might this problem have on the native australian species of animals in the area?
- Each graph represents different environmental conditions (unfavorable, equilibrium, favorable) that impact the frog population differently, leading to distinct population trends.
- A higher birthrate increases the frog population, which will eventually outstrip available resources like food, water, or habitat, causing starvation, competition, and a population crash.
- A. Increased availability of food sources (e.g., insects) means more frogs can survive and reproduce.
B. Reduction in natural predators (e.g., snakes, birds) lowers frog mortality rates.
- A. Spread of a contagious disease kills large numbers of frogs quickly.
B. Habitat destruction (e.g., deforestation, pollution) removes living and breeding spaces.
- A population stays in equilibrium when the birth rate equals the death rate, and resources (food, space) remain stable with no major environmental changes or disruptions.
- Simply stopping harmful human activity is often not enough. To aid recovery, targeted interventions like habitat restoration, supplementary feeding, captive breeding and reintroduction, and controlling remaining threats (like invasive species) are needed to support the small population's growth.
- Native Australian predators (like snakes, lizards, or mammals) may try to eat the toxic cane toads and die from poisoning, reducing their populations. This disrupts the local food web, and the cane toads may also outcompete native amphibians for resources, further harming native species.

Snap & solve any problem in the app
Get step-by-step solutions on Sovi AI
Photo-based solutions with guided steps
Explore more problems and detailed explanations
- Different environmental conditions drive distinct population trends.
- Overpopulation depletes resources, causing a crash.
- A. Increased food availability
B. Reduced predator numbers
- A. Disease outbreak
B. Habitat destruction/pollution
- Balanced birth/death rates + stable resources.
- No, it is not enough. Targeted actions like habitat restoration, captive breeding, and threat control are required.
- Native predators may die from eating toxic toads, and native species may be outcompeted, disrupting the local ecosystem.