QUESTION IMAGE
Question
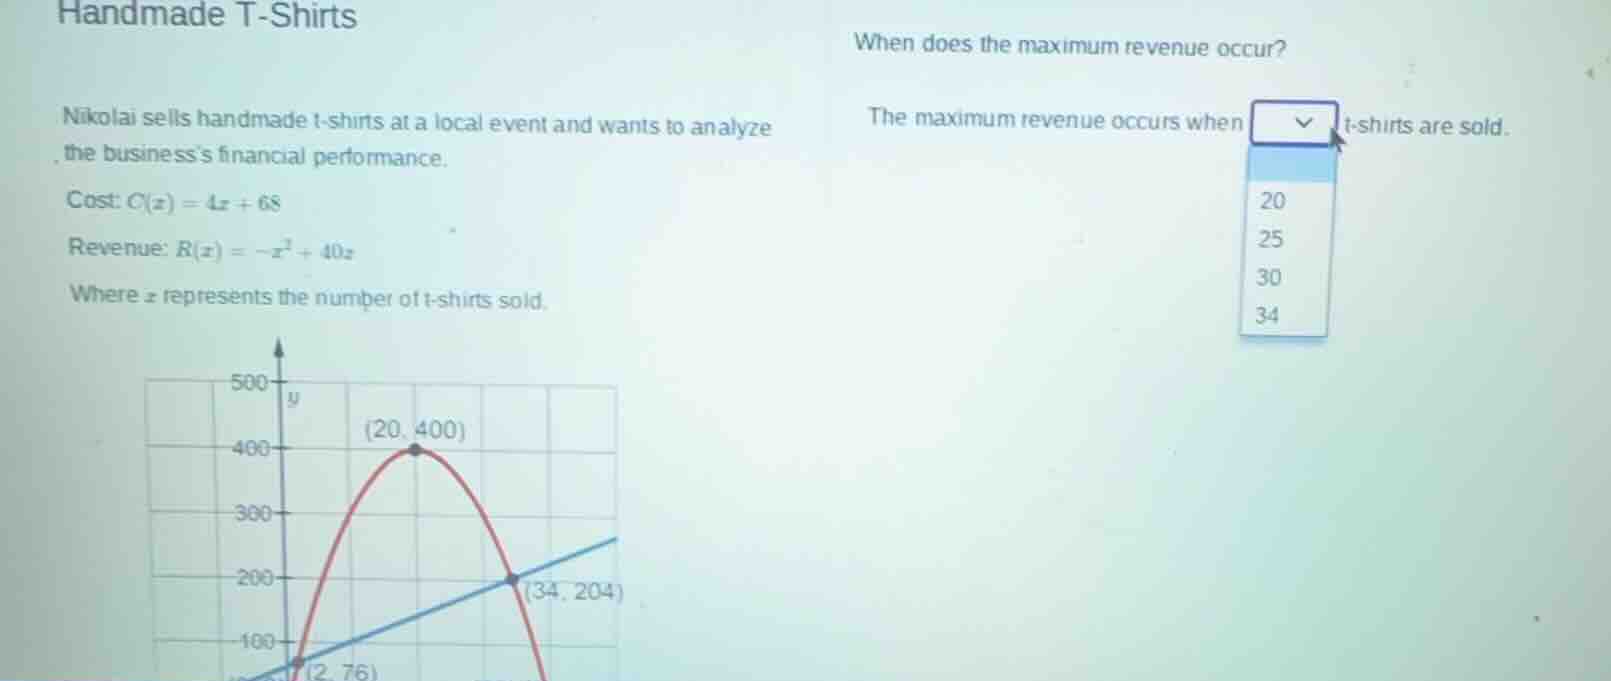
handmade t - shirts
nikolai sells handmade t - shirts at a local event and wants to analyze the business’s financial performance.
cost: $c(x)=4x + 68$
revenue: $r(x)=-x^{2}+40x$
where $x$ represents the number of t - shirts sold.
when does the maximum revenue occur?
the maximum revenue occurs when dropdown t - shirts are sold.
dropdown options: 20, 25, 30, 34
chart: a graph with a red parabola (revenue function) and a blue line (cost function). the parabola has a vertex at (20, 400), and the two graphs intersect at (34, 204) and another point (2, 76).
Step1: Identify revenue function type
The revenue function $R(x) = -x^2 + 40x$ is a quadratic function in the form $ax^2+bx+c$, where $a=-1$, $b=40$, $c=0$. Since $a<0$, the parabola opens downward, so its vertex is the maximum point.
Step2: Calculate vertex x-coordinate
For a quadratic function $ax^2+bx+c$, the x-coordinate of the vertex is given by $x = -\frac{b}{2a}$.
Substitute $a=-1$, $b=40$:

Snap & solve any problem in the app
Get step-by-step solutions on Sovi AI
Photo-based solutions with guided steps
Explore more problems and detailed explanations
20