QUESTION IMAGE
Question
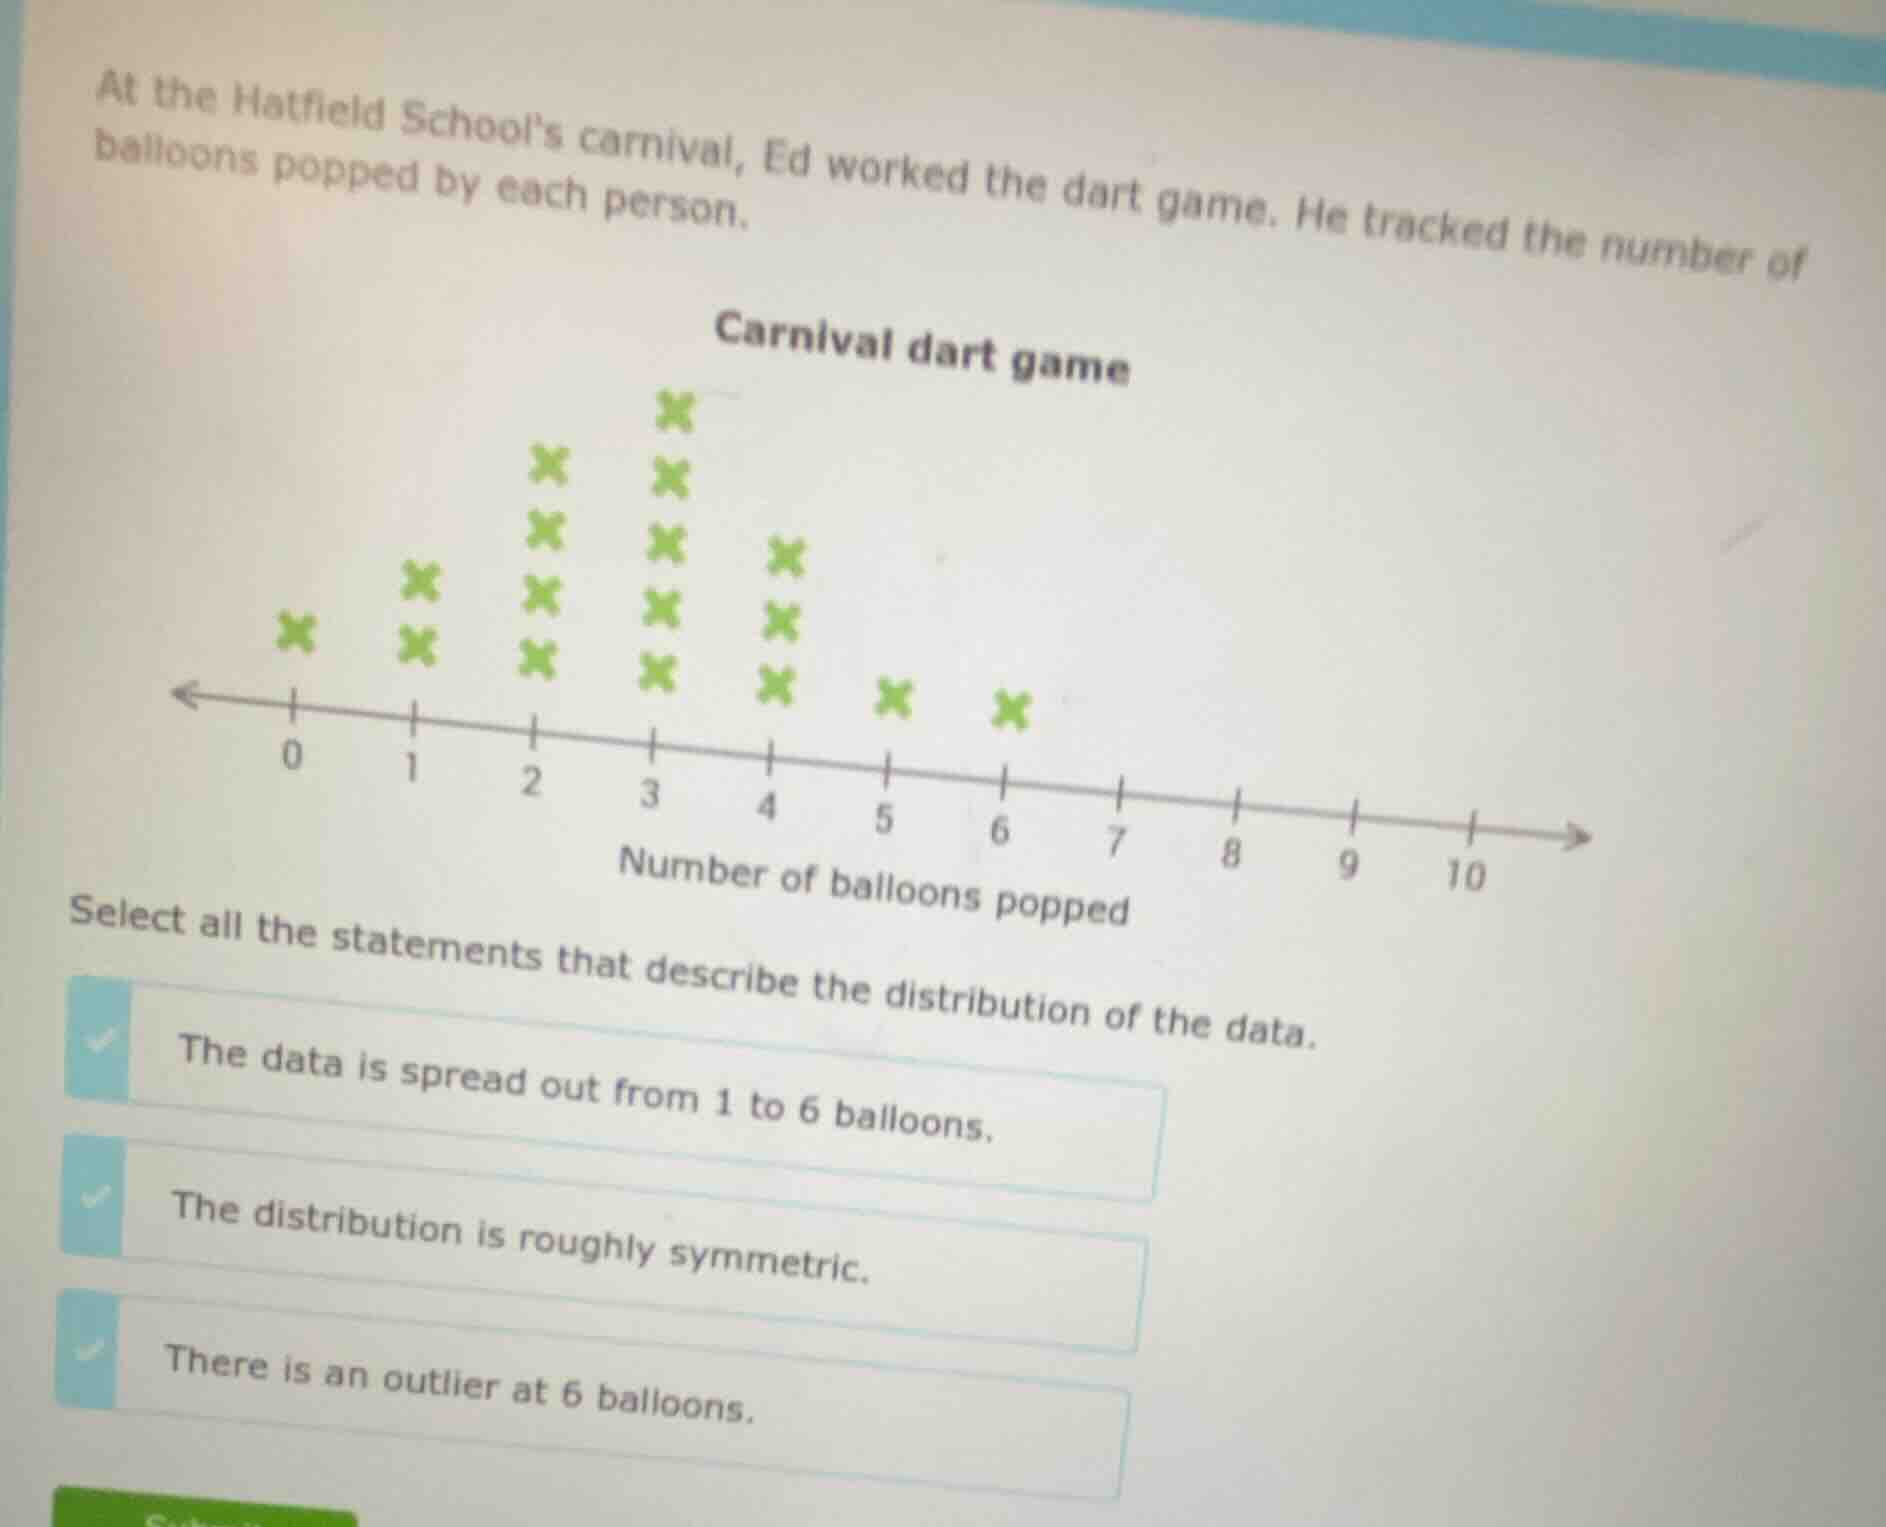
at the hatfield schools carnival, ed worked the dart game. he tracked the number of balloons popped by each person.
carnival dart game
number of balloons popped
select all the statements that describe the distribution of the data.
the data is spread out from 1 to 6 balloons.
the distribution is roughly symmetric.
there is an outlier at 6 balloons.
Step1: List all data points
From the line plot: 0, 1, 1, 2, 2, 2, 3, 3, 3, 3, 4, 4, 4, 5, 6
Step2: Check data spread
Minimum value = 0, maximum value = 6. So data spans 0 to 6, not 1 to 6.
Step3: Check symmetry
Count of values: 0(1), 1(2), 2(3), 3(4), 4(3), 5(1), 6(1). The center is 3, with counts decreasing symmetrically outward (except 5/6, which are low counts but overall shape is roughly symmetric).
Step4: Check for outliers
6 is the maximum, but it is only 1 unit above 5, and the range is small. There is no extreme value far from the cluster, so 6 is not an outlier.

Snap & solve any problem in the app
Get step-by-step solutions on Sovi AI
Photo-based solutions with guided steps
Explore more problems and detailed explanations
The correct statement is:
- The distribution is roughly symmetric.