QUESTION IMAGE
Question
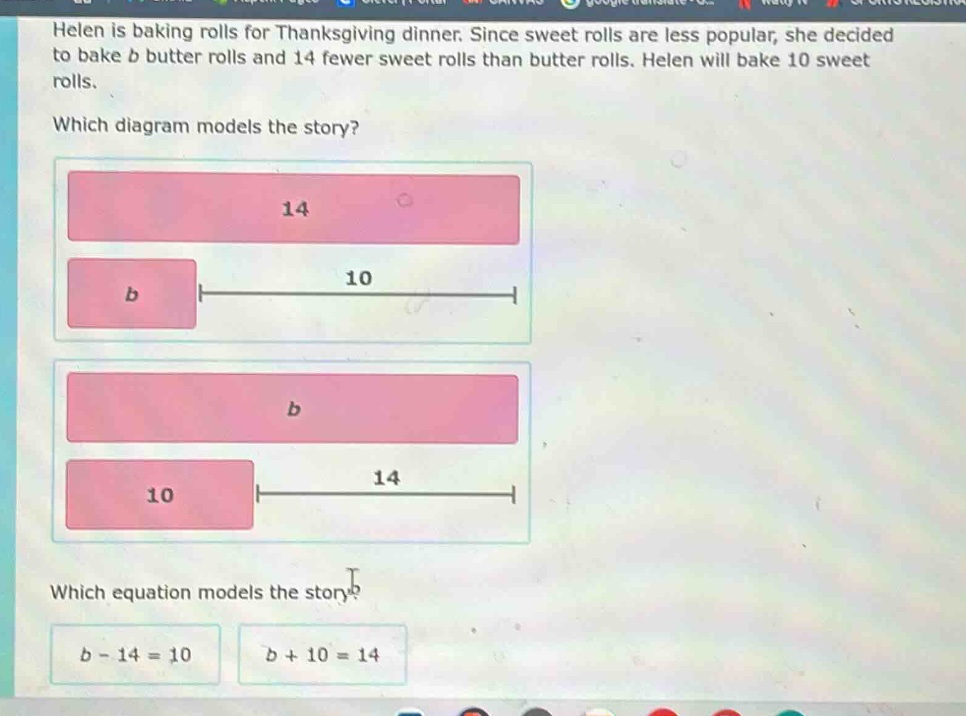
helen is baking rolls for thanksgiving dinner. since sweet rolls are less popular, she decided to bake ( b ) butter rolls and 14 fewer sweet rolls than butter rolls. helen will bake 10 sweet rolls.
which diagram models the story?
diagram 1: a pink rectangle labeled 14, below it a pink rectangle labeled ( b ) with a black line labeled 10 next to it
diagram 2: a pink rectangle labeled ( b ), below it a pink rectangle labeled 10 with a black line labeled 14 next to it
which equation models the story?
( b - 14 = 10 )
( b + 10 = 14 )
Part 1: Which diagram models the story?
We know Helen bakes \( b \) butter rolls and 14 fewer sweet rolls than butter rolls, with sweet rolls being 10. So the butter rolls (\( b \)) should be a longer bar, and sweet rolls (10) plus 14 should equal \( b \). The second diagram has \( b \) as the longer bar, and 10 (sweet rolls) with a segment of 14 to reach \( b \), which matches the relationship (sweet rolls = butter rolls - 14, so butter rolls = sweet rolls + 14). The first diagram misrepresents the relationship.
Step1: Analyze the relationship
Sweet rolls are 14 fewer than butter rolls. Let butter rolls be \( b \), sweet rolls be 10. So, butter rolls minus 14 equals sweet rolls.
Step2: Form the equation
From the relationship \( b - 14 = 10 \), since \( b \) (butter rolls) - 14 (fewer) = 10 (sweet rolls). The other equation \( b + 10 = 14 \) does not fit as it would imply \( b \) is negative, which doesn't make sense for the number of rolls.

Snap & solve any problem in the app
Get step-by-step solutions on Sovi AI
Photo-based solutions with guided steps
Explore more problems and detailed explanations
The second diagram (the one with \( b \) as the top bar, 10 as the bottom bar, and 14 as the segment to reach \( b \))