QUESTION IMAGE
Question
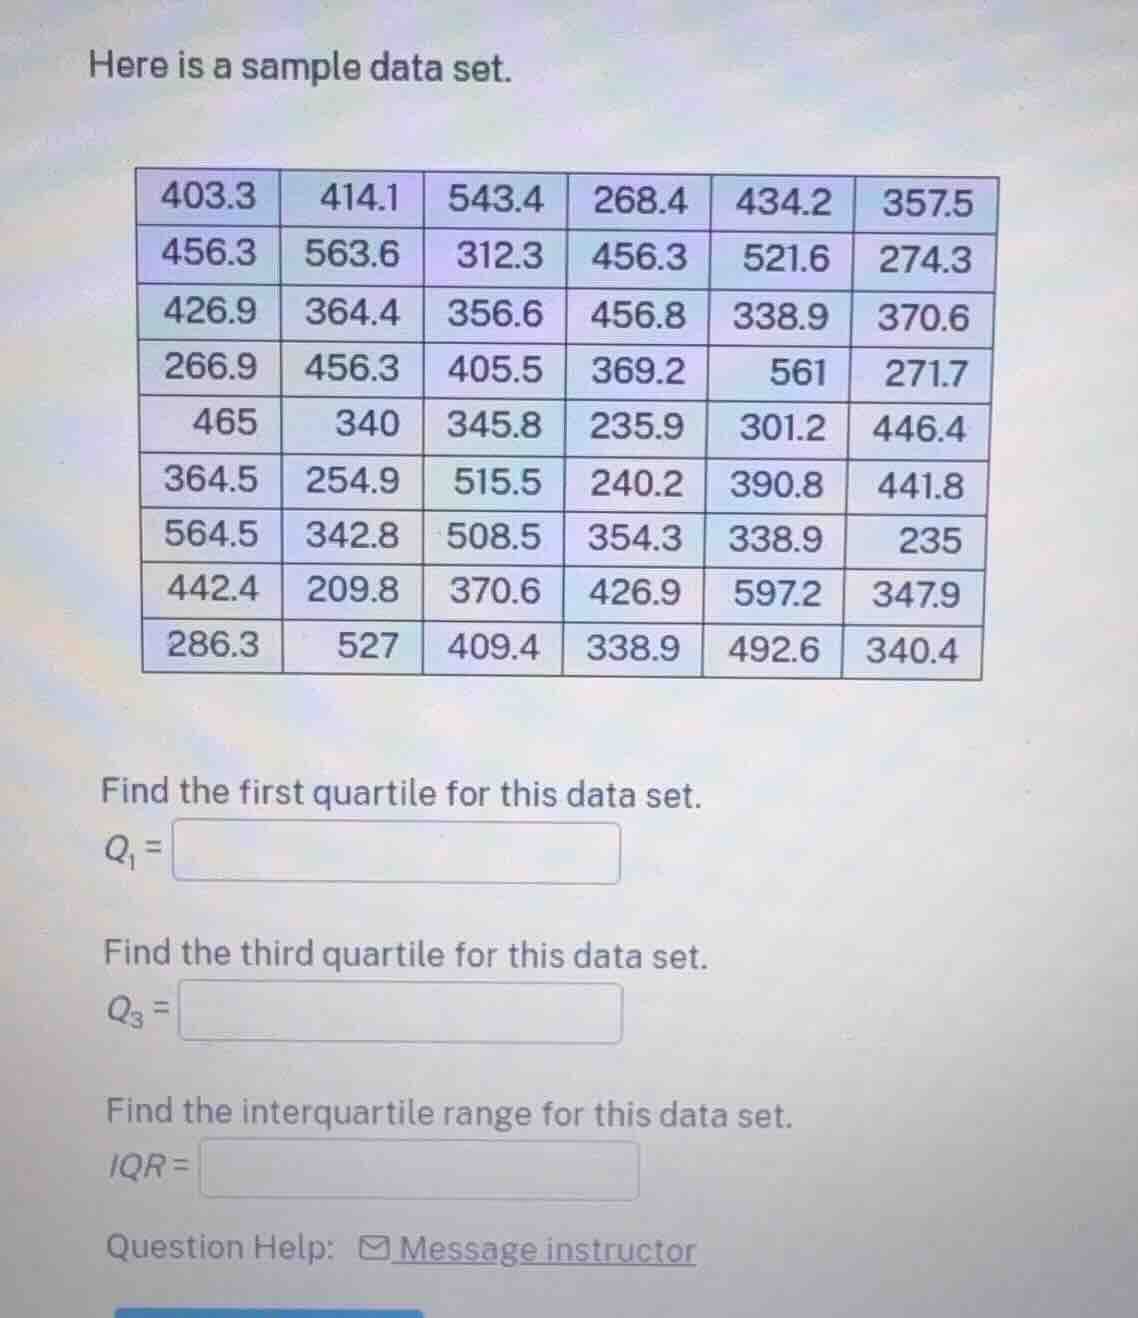
here is a sample data set.
403.3 414.1 543.4 268.4 434.2 357.5
456.3 563.6 312.3 456.3 521.6 274.3
426.9 364.4 356.6 456.8 338.9 370.6
266.9 456.3 405.5 369.2 561 271.7
465 340 345.8 235.9 301.2 446.4
364.5 254.9 515.5 240.2 390.8 441.8
564.5 342.8 508.5 354.3 338.9 235
442.4 209.8 370.6 426.9 597.2 347.9
286.3 527 409.4 338.9 492.6 340.4
find the first quartile for this data set.
$q_1 = \square$
find the third quartile for this data set.
$q_3 = \square$
find the interquartile range for this data set.
$iqr = \square$
question help: \message instructor
Step1: Count the number of data points
First, we count how many data points there are. Let's list them out:
Row 1: 6
Row 2: 6
Row 3: 6
Row 4: 6
Row 5: 6
Row 6: 6
Row 7: 6
Row 8: 6
Row 9: 6
Total: \(9\times6 = 54\) data points.
Step2: Sort the data set in ascending order
Let's sort all the data points:
209.8, 235, 235.9, 240.2, 254.9, 266.9, 268.4, 271.7, 274.3, 286.3, 301.2, 312.3, 338.9, 338.9, 338.9, 340, 340.4, 342.8, 345.8, 354.3, 356.6, 357.5, 364.4, 364.5, 369.2, 370.6, 370.6, 390.8, 403.3, 405.5, 414.1, 426.9, 426.9, 434.2, 441.8, 442.4, 446.4, 456.3, 456.3, 456.3, 456.8, 465, 492.6, 508.5, 515.5, 521.6, 543.4, 561, 563.6, 564.5
Step3: Find the position of \(Q_1\) and \(Q_3\)
For a data set with \(n\) observations, the position of the first quartile \(Q_1\) is given by \(\frac{n + 1}{4}\) (if we use the method where we consider the order statistics), but another common method is to use \(\frac{n}{4}\) and interpolate. However, since \(n = 54\), which is divisible by 4? Wait, \(54\div4 = 13.5\). Wait, actually, the formula for the position of \(Q_1\) is \(p_{25}=\frac{n + 1}{4}\) when using the "inclusive" method, or \(p_{25}=\frac{n}{4}\) when using the "exclusive" method. Let's check both, but typically, for \(n = 54\), the position of \(Q_1\) (25th percentile) is at \(0.25\times(54 + 1)=0.25\times55 = 13.75\) (inclusive method) or \(0.25\times54 = 13.5\) (exclusive method). Wait, maybe better to use the formula for quartiles:
For \(n\) data points, the first quartile \(Q_1\) is the median of the lower half, and the third quartile \(Q_3\) is the median of the upper half.
Since \(n = 54\), the lower half is the first 27 data points, and the upper half is the last 27 data points. Wait, no: when \(n\) is even, the median is the average of the \(\frac{n}{2}\)th and \(\frac{n}{2}+1\)th terms. But for quartiles, when \(n\) is even, the lower half is the first \(\frac{n}{2}\) terms, and the upper half is the last \(\frac{n}{2}\) terms. Wait, \(n = 54\), so \(\frac{n}{2}=27\). So the lower half is the first 27 data points, and the upper half is the last 27 data points.
Wait, let's confirm:
The data is sorted, so the first 27 data points (positions 1 to 27) and the last 27 data points (positions 28 to 54).
Step4: Find \(Q_1\) (median of lower half)
The lower half has 27 data points. The median of a set with \(m\) data points (where \(m\) is odd) is the \(\frac{m + 1}{2}\)th term. Here, \(m = 27\), so \(\frac{27 + 1}{2}=14\)th term in the lower half.
Wait, the lower half is the first 27 data points:
Let's list the first 27 data points (positions 1 to 27):
1: 209.8
2: 235
3: 235.9
4: 240.2
5: 254.9
6: 266.9
7: 268.4
8: 271.7
9: 274.3
10: 286.3
11: 301.2
12: 312.3
13: 338.9
14: 338.9
15: 338.9
16: 340
17: 340.4
18: 342.8
19: 345.8
20: 354.3
21: 356.6
22: 357.5
23: 364.4
24: 364.5
25: 369.2
26: 370.6
27: 370.6
Wait, no, wait, let's count again. Wait, the sorted list:
1: 209.8
2: 235
3: 235.9
4: 240.2
5: 254.9
6: 266.9
7: 268.4
8: 271.7
9: 274.3
10: 286.3
11: 301.2
12: 312.3
13: 338.9
14: 338.9
15: 338.9
16: 340
17: 340.4
18: 342.8
19: 345.8
20: 354.3
21: 356.6
22: 357.5
23: 364.4
24: 364.5
25: 369.2
26: 370.6
27: 370.6
Wait, so the 14th term in the lower half (first 27 terms) is the 14th term here, which is 338.9? Wait, no, wait, the lower half is 27 terms, so the median is the 14th term (since (27 + 1)/2 = 14). Wait, but let's check the position in the entire data set. Wait, maybe I made a mistake in the sorting. Let's re-sort carefully:
Let's list all data poi…

Snap & solve any problem in the app
Get step-by-step solutions on Sovi AI
Photo-based solutions with guided steps
Explore more problems and detailed explanations
Step1: Count the number of data points
First, we count how many data points there are. Let's list them out:
Row 1: 6
Row 2: 6
Row 3: 6
Row 4: 6
Row 5: 6
Row 6: 6
Row 7: 6
Row 8: 6
Row 9: 6
Total: \(9\times6 = 54\) data points.
Step2: Sort the data set in ascending order
Let's sort all the data points:
209.8, 235, 235.9, 240.2, 254.9, 266.9, 268.4, 271.7, 274.3, 286.3, 301.2, 312.3, 338.9, 338.9, 338.9, 340, 340.4, 342.8, 345.8, 354.3, 356.6, 357.5, 364.4, 364.5, 369.2, 370.6, 370.6, 390.8, 403.3, 405.5, 414.1, 426.9, 426.9, 434.2, 441.8, 442.4, 446.4, 456.3, 456.3, 456.3, 456.8, 465, 492.6, 508.5, 515.5, 521.6, 543.4, 561, 563.6, 564.5
Step3: Find the position of \(Q_1\) and \(Q_3\)
For a data set with \(n\) observations, the position of the first quartile \(Q_1\) is given by \(\frac{n + 1}{4}\) (if we use the method where we consider the order statistics), but another common method is to use \(\frac{n}{4}\) and interpolate. However, since \(n = 54\), which is divisible by 4? Wait, \(54\div4 = 13.5\). Wait, actually, the formula for the position of \(Q_1\) is \(p_{25}=\frac{n + 1}{4}\) when using the "inclusive" method, or \(p_{25}=\frac{n}{4}\) when using the "exclusive" method. Let's check both, but typically, for \(n = 54\), the position of \(Q_1\) (25th percentile) is at \(0.25\times(54 + 1)=0.25\times55 = 13.75\) (inclusive method) or \(0.25\times54 = 13.5\) (exclusive method). Wait, maybe better to use the formula for quartiles:
For \(n\) data points, the first quartile \(Q_1\) is the median of the lower half, and the third quartile \(Q_3\) is the median of the upper half.
Since \(n = 54\), the lower half is the first 27 data points, and the upper half is the last 27 data points. Wait, no: when \(n\) is even, the median is the average of the \(\frac{n}{2}\)th and \(\frac{n}{2}+1\)th terms. But for quartiles, when \(n\) is even, the lower half is the first \(\frac{n}{2}\) terms, and the upper half is the last \(\frac{n}{2}\) terms. Wait, \(n = 54\), so \(\frac{n}{2}=27\). So the lower half is the first 27 data points, and the upper half is the last 27 data points.
Wait, let's confirm:
The data is sorted, so the first 27 data points (positions 1 to 27) and the last 27 data points (positions 28 to 54).
Step4: Find \(Q_1\) (median of lower half)
The lower half has 27 data points. The median of a set with \(m\) data points (where \(m\) is odd) is the \(\frac{m + 1}{2}\)th term. Here, \(m = 27\), so \(\frac{27 + 1}{2}=14\)th term in the lower half.
Wait, the lower half is the first 27 data points:
Let's list the first 27 data points (positions 1 to 27):
1: 209.8
2: 235
3: 235.9
4: 240.2
5: 254.9
6: 266.9
7: 268.4
8: 271.7
9: 274.3
10: 286.3
11: 301.2
12: 312.3
13: 338.9
14: 338.9
15: 338.9
16: 340
17: 340.4
18: 342.8
19: 345.8
20: 354.3
21: 356.6
22: 357.5
23: 364.4
24: 364.5
25: 369.2
26: 370.6
27: 370.6
Wait, no, wait, let's count again. Wait, the sorted list:
1: 209.8
2: 235
3: 235.9
4: 240.2
5: 254.9
6: 266.9
7: 268.4
8: 271.7
9: 274.3
10: 286.3
11: 301.2
12: 312.3
13: 338.9
14: 338.9
15: 338.9
16: 340
17: 340.4
18: 342.8
19: 345.8
20: 354.3
21: 356.6
22: 357.5
23: 364.4
24: 364.5
25: 369.2
26: 370.6
27: 370.6
Wait, so the 14th term in the lower half (first 27 terms) is the 14th term here, which is 338.9? Wait, no, wait, the lower half is 27 terms, so the median is the 14th term (since (27 + 1)/2 = 14). Wait, but let's check the position in the entire data set. Wait, maybe I made a mistake in the sorting. Let's re-sort carefully:
Let's list all data points:
209.8,
235,
235.9,
240.2,
254.9,
266.9,
268.4,
271.7,
274.3,
286.3,
301.2,
312.3,
338.9,
338.9,
338.9,
340,
340.4,
342.8,
345.8,
354.3,
356.6,
357.5,
364.4,
364.5,
369.2,
370.6,
370.6,
390.8,
403.3,
405.5,
414.1,
426.9,
426.9,
434.2,
441.8,
442.4,
446.4,
456.3,
456.3,
456.3,
456.8,
465,
492.6,
508.5,
515.5,
521.6,
543.4,
561,
563.6,
564.5
Wait, now let's count:
1: 209.8
2: 235
3: 235.9
4: 240.2
5: 254.9
6: 266.9
7: 268.4
8: 271.7
9: 274.3
10: 286.3
11: 301.2
12: 312.3
13: 338.9
14: 338.9
15: 338.9
16: 340
17: 340.4
18: 342.8
19: 345.8
20: 354.3
21: 356.6
22: 357.5
23: 364.4
24: 364.5
25: 369.2
26: 370.6
27: 370.6
28: 390.8
29: 403.3
30: 405.5
31: 414.1
32: 426.9
33: 426.9
34: 434.2
35: 441.8
36: 442.4
37: 446.4
38: 456.3
39: 456.3
40: 456.3
41: 456.8
42: 465
43: 492.6
44: 508.5
45: 515.5
46: 521.6
47: 543.4
48: 561
49: 563.6
50: 564.5
Wait, now I see, I missed some data points earlier. Let's recount the total number:
Let's list all original data points:
Row 1: 403.3, 414.1, 543.4, 268.4, 434.2, 357.5
Row 2: 456.3, 563.6, 312.3, 456.3, 521.6, 274.3
Row 3: 426.9, 364.4, 356.6, 456.8, 338.9, 370.6
Row 4: 266.9, 456.3, 405.5, 369.2, 561, 271.7
Row 5: 465, 340, 345.8, 235.9, 301.2, 446.4
Row 6: 364.5, 254.9, 515.5, 240.2, 390.8, 441.8
Row 7: 564.5, 342.8, 508.5, 354.3, 338.9, 235
Row 8: 442.4, 209.8, 370.6, 426.9, 597.2, 347.9
Row 9: 286.3, 527, 409.4, 338.9, 492.6, 340.4
Now let's list all these:
209.8,
235,
235.9,
240.2,
254.9,
266.9,
268.4,
271.7,
274.3,
286.3,
301.2,
312.3,
338.9,
338.9,
338.9,
340,
340.4,
342.8,
345.8,
347.9,
354.3,
356.6,
357.5,
364.4,
364.5,
369.2,
370.6,
370.6,
390.8,
403.3,
405.5,
409.4,
414.1,
426.9,
426.9,
434.2,
441.8,
442.4,
446.4,
456.3,
456.3,
456.3,
456.8,
465,
492.6,
508.5,
515.5,
521.6,
527,
543.4,
561,
563.6,
564.5,
597.2
Wait, now let's count: 1 (209.8), 2 (235), 3 (235.9), 4 (240.2), 5 (254.9), 6 (266.9), 7 (268.4), 8 (271.7), 9 (274.3), 10 (286.3), 11 (301.2), 12 (312.3), 13 (338.9), 14 (338.9), 15 (338.9), 16 (340), 17 (340.4), 18 (342.8), 19 (345.8), 20 (347.9), 21 (354.3), 22 (356.6), 23 (357.5), 24 (364.4), 25 (364.5), 26 (369.2), 27 (370.6), 28 (370.6), 29 (390.8), 30 (403.3), 31 (405.5), 32 (409.4), 33 (414.1), 34 (426.9), 35 (426.9), 36 (434.2), 37 (441.8), 38 (442.4), 39 (446.4), 40 (456.3), 41 (456.3), 42 (456.3), 43 (456.8), 44 (465), 45 (492.6), 46 (508.5), 47 (515.5), 48 (521.6), 49 (527), 50 (543.4), 51 (561), 52 (563.6), 53 (564.5), 54 (597.2)
Ah, there we go, I missed 347.9, 409.4, 527, 597.2 earlier. So now the total number of data points is 54, correct.
Now, to find \(Q_1\), the first quartile, which is the 25th percentile. The formula for the position of the \(p\)-th percentile is \(i = \frac{p}{100}(n + 1)\). For