QUESTION IMAGE
Question
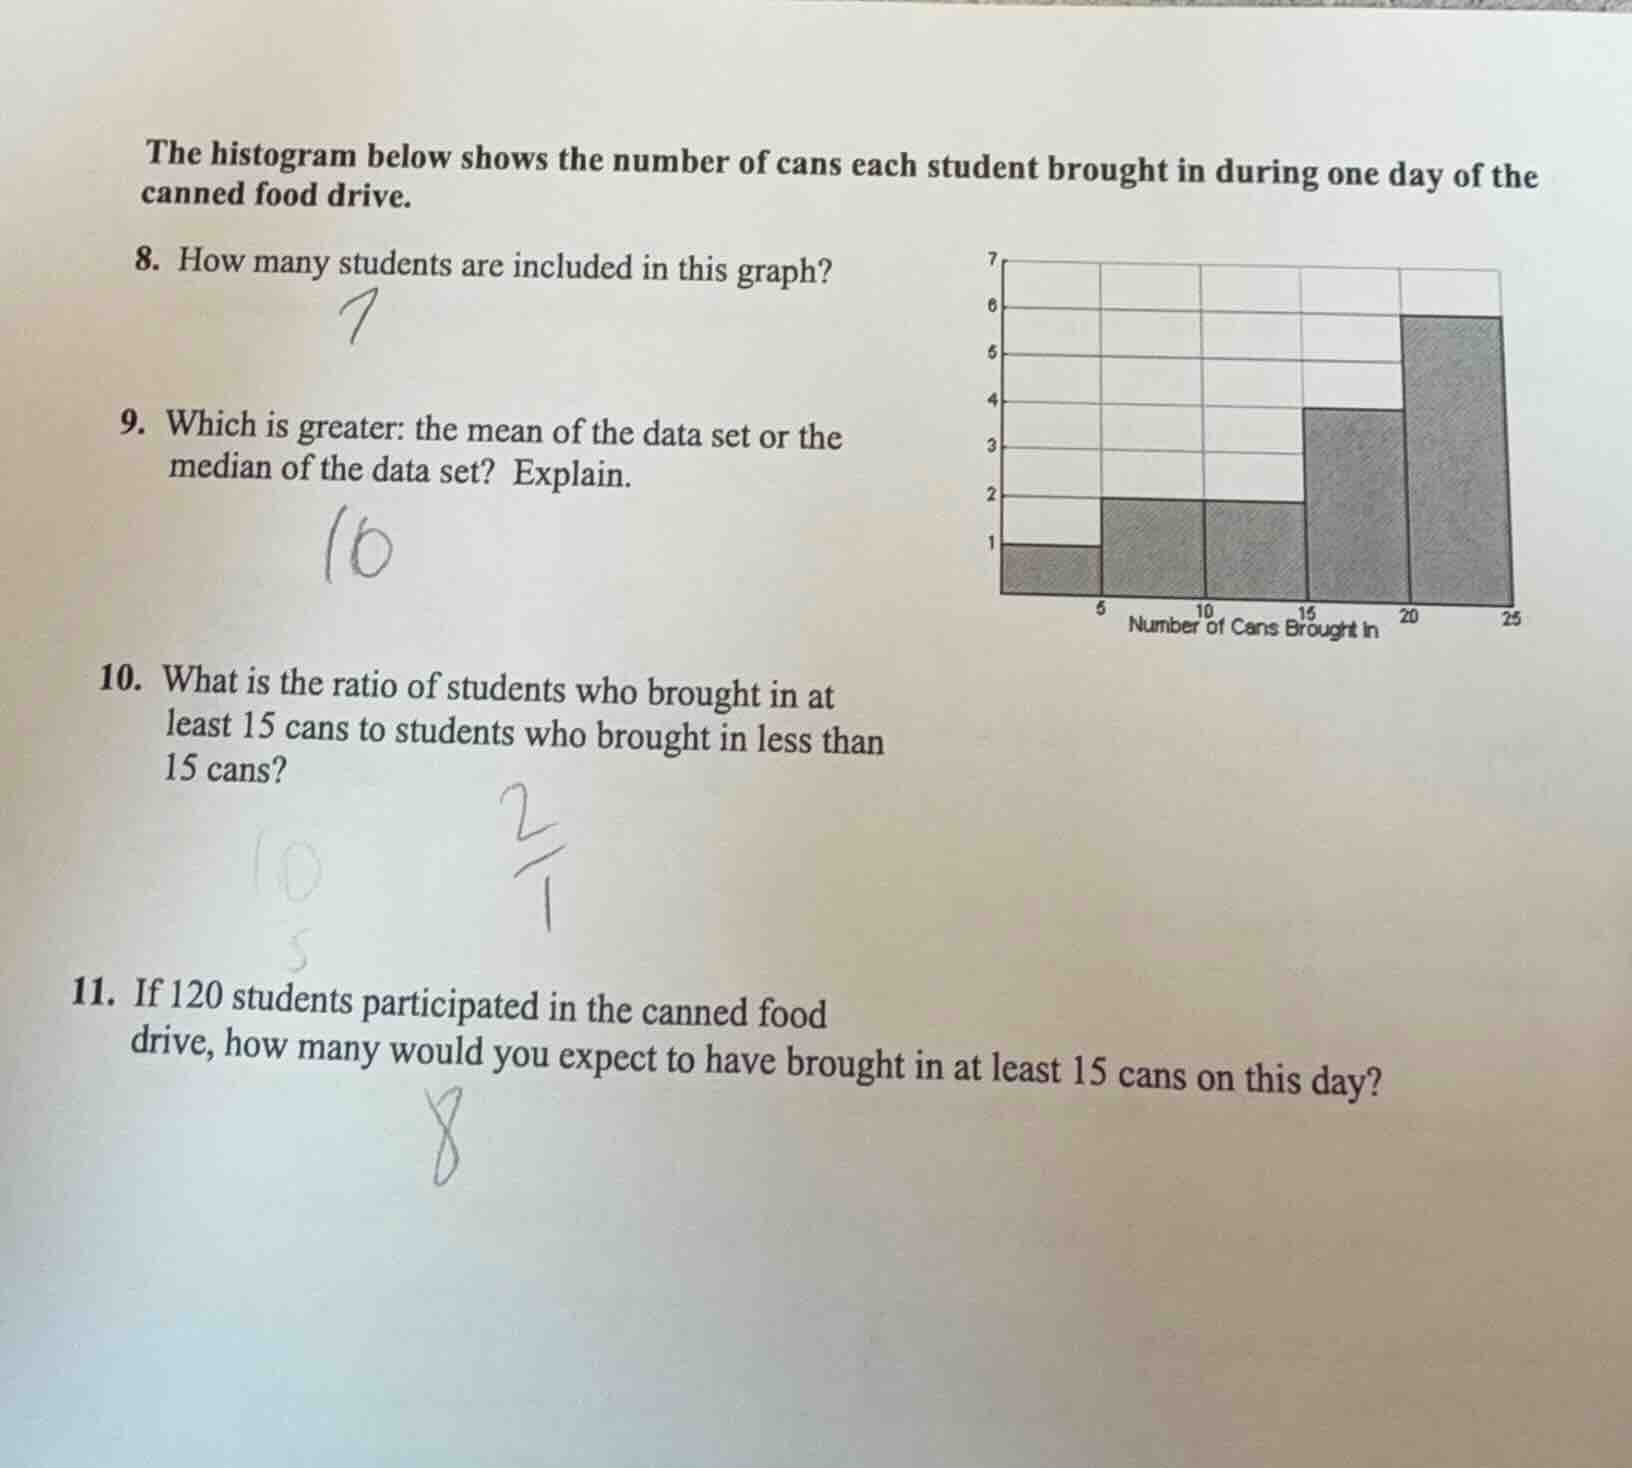
the histogram below shows the number of cans each student brought in during one day of the canned food drive.
- how many students are included in this graph?
- which is greater: the mean of the data set or the median of the data set? explain.
- what is the ratio of students who brought in at least 15 cans to students who brought in less than 15 cans?
- if 120 students participated in the canned food drive, how many would you expect to have brought in at least 15 cans on this day?
Step1: Sum all student counts
$1 + 2 + 2 + 4 + 6 = 15$
Step2: Calculate mean (use midpoints)
Midpoints: 2.5, 7.5, 12.5, 17.5, 22.5
$\text{Mean} = \frac{(1 \times 2.5) + (2 \times 7.5) + (2 \times 12.5) + (4 \times 17.5) + (6 \times 22.5)}{15}$
$= \frac{2.5 + 15 + 25 + 70 + 135}{15} = \frac{247.5}{15} = 16.5$
Step3: Find median (8th value)
Ordered data: 2.5, 7.5,7.5,12.5,12.5,17.5,17.5,17.5,17.5,22.5,22.5,22.5,22.5,22.5,22.5
Median = 17.5
Step4: Compare mean and median
$17.5 > 16.5$, so median > mean
Step5: Count students for ratio
At least 15 cans: $4 + 6 = 10$; Less than 15 cans: $1 + 2 + 2 = 5$
Ratio: $\frac{10}{5} = 2:1$
Step6: Calculate expected students
Proportion of ≥15 cans: $\frac{10}{15} = \frac{2}{3}$
Expected: $120 \times \frac{2}{3} = 80$

Snap & solve any problem in the app
Get step-by-step solutions on Sovi AI
Photo-based solutions with guided steps
Explore more problems and detailed explanations
- 15
- The median is greater. The mean is 16.5 and the median is 17.5; the data is left-skewed, so the median is higher than the mean.
- $2:1$
- 80