QUESTION IMAGE
Question
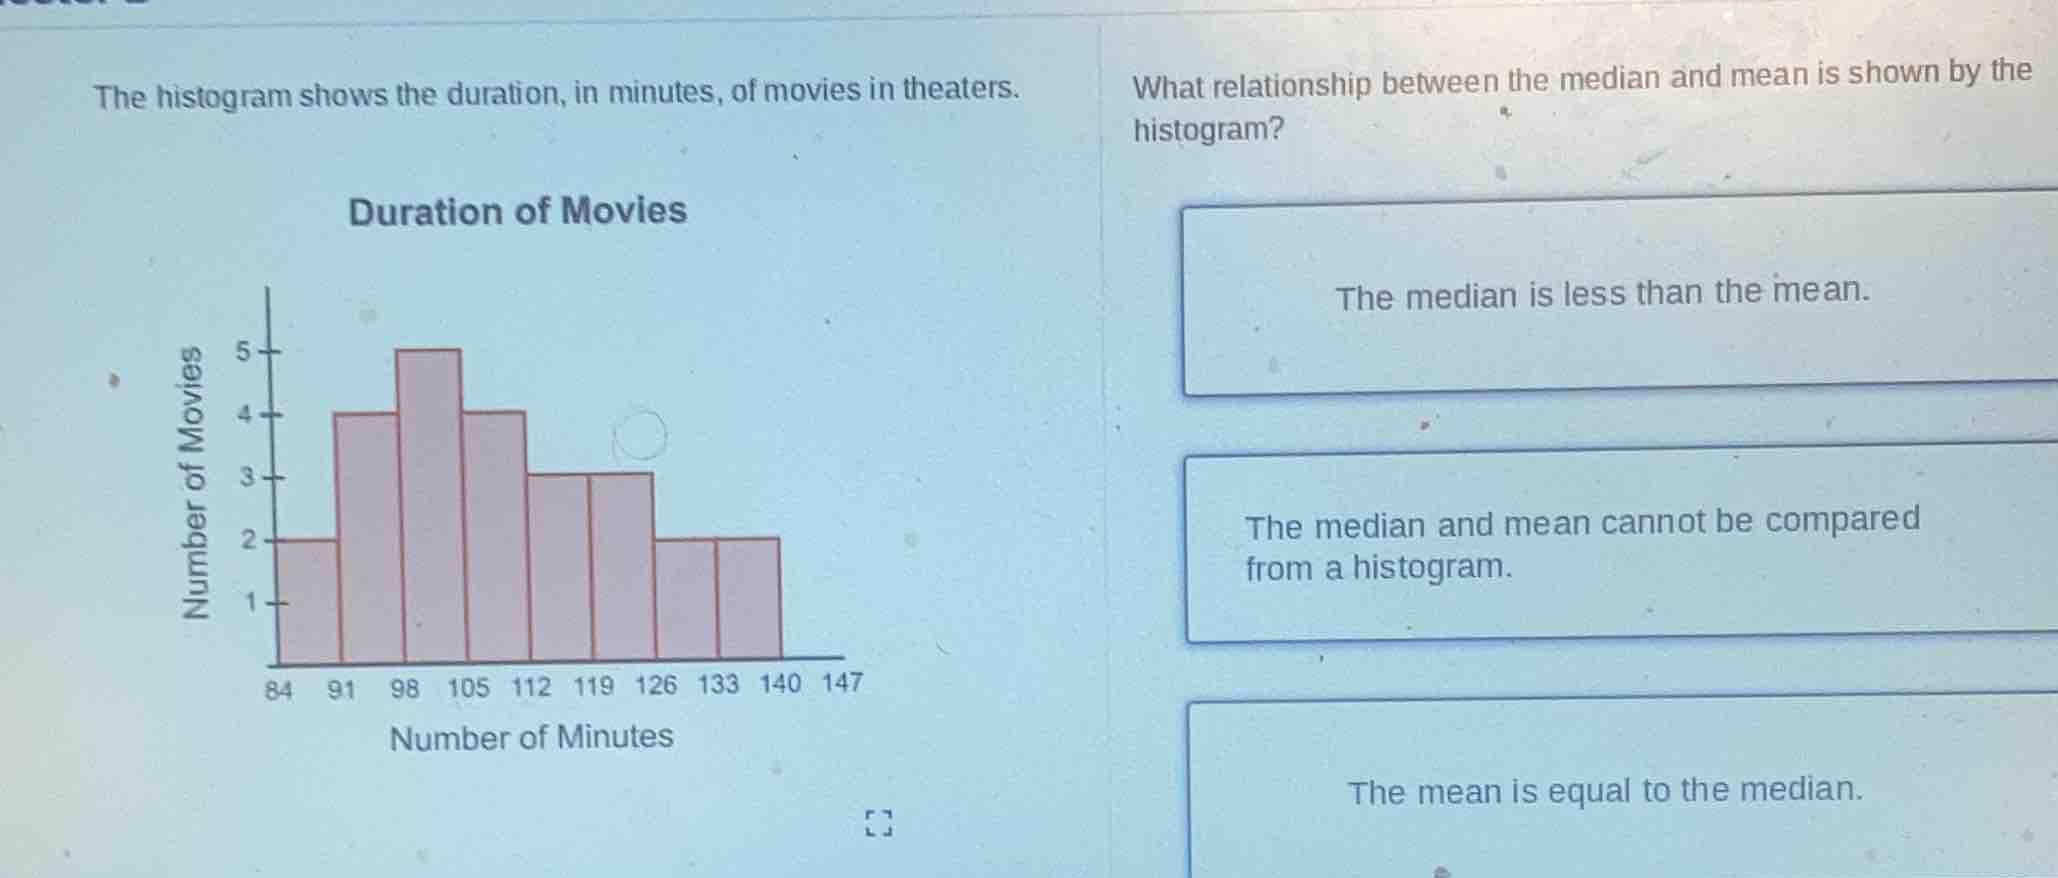
the histogram shows the duration, in minutes, of movies in theaters.
what relationship between the median and mean is shown by the histogram?
the median is less than the mean.
the median and mean cannot be compared from a histogram.
the mean is equal to the median.
Step1: Analyze the Histogram Shape
The histogram is roughly symmetric? Wait, no, let's check the distribution. Wait, actually, the left and right tails: the left tail (lower durations) and right tail (higher durations). Wait, the histogram here: let's count the number of movies in each bin. The bins are 84 - 91, 91 - 98, 98 - 105, 105 - 112, 112 - 119, 119 - 126, 126 - 133, 133 - 140, 140 - 147. Wait, the counts: 84 - 91: 2, 91 - 98: 4, 98 - 105: 5, 105 - 112: 4, 112 - 119: 3, 119 - 126: 3, 126 - 133: 2, 133 - 140: 2, 140 - 147: 2? Wait, no, the y-axis is number of movies. Wait, the first bar (84 - 91) has height 2, next (91 - 98) height 4, (98 - 105) height 5, (105 - 112) height 4, (112 - 119) height 3, (119 - 126) height 3, (126 - 133) height 2, (133 - 140) height 2, (140 - 147) height 2? Wait, maybe I miscounted. But the key is the distribution's skewness. Wait, actually, the histogram here: the peak is around 98 - 105, and then it tapers off on both sides? Wait, no, the right tail (higher durations: 119+, 126+, etc.) has some bars, but the left tail (lower durations: 84 - 91, 91 - 98) also has bars. Wait, maybe the distribution is symmetric? Wait, no, wait, the mean and median in a symmetric distribution are equal, but if it's skewed right, mean > median; skewed left, mean < median. Wait, but in this histogram, let's see: the right tail (higher durations) – the bins from 119 onwards: 119 - 126: 3, 126 - 133: 2, 133 - 140: 2, 140 - 147: 2. The left tail: 84 - 91: 2, 91 - 98: 4. Wait, maybe the distribution is roughly symmetric? Wait, no, wait the first option: "The median is less than the mean" – when is that true? When the distribution is skewed right (long right tail), because the mean is pulled up by the high values. Wait, but in this histogram, does the right tail have more weight? Wait, maybe I made a mistake. Wait, let's calculate the total number of movies. Let's sum the heights: 2 (84-91) + 4 (91-98) + 5 (98-105) + 4 (105-112) + 3 (112-119) + 3 (119-126) + 2 (126-133) + 2 (133-140) + 2 (140-147) = 2+4=6, +5=11, +4=15, +3=18, +3=21, +2=23, +2=25, +2=27. So 27 movies. The median is the 14th value (since 27 is odd, (27+1)/2=14th). Let's find the bin where the 14th value is. Cumulative counts: 84-91: 2 (total 2), 91-98: 4 (total 6), 98-105: 5 (total 11), 105-112: 4 (total 15). So the 14th value is in 105-112 bin. Now, the mean: we need to calculate the midpoint of each bin and multiply by the number of movies, sum, then divide by 27. Let's take midpoints: 84-91: midpoint 87.5, count 2: 87.52=175; 91-98: midpoint 94.5, count 4: 94.54=378; 98-105: midpoint 101.5, count 5: 101.55=507.5; 105-112: midpoint 108.5, count 4: 108.54=434; 112-119: midpoint 115.5, count 3: 115.53=346.5; 119-126: midpoint 122.5, count 3: 122.53=367.5; 126-133: midpoint 129.5, count 2: 129.52=259; 133-140: midpoint 136.5, count 2: 136.52=273; 140-147: midpoint 143.5, count 2: 143.5*2=287. Now sum all these: 175 + 378 = 553; +507.5=1060.5; +434=1494.5; +346.5=1841; +367.5=2208.5; +259=2467.5; +273=2740.5; +287=3027.5. Now mean is 3027.5 / 27 ≈ 112.13. Now median: the 14th value. Cumulative counts: up to 98-105: 11, so 14 - 11 = 3rd value in 105-112 bin. The midpoint of 105-112 is 108.5, so median is around 108.5? Wait, no, wait the bin 105-112 has 4 movies, so the 12th to 15th values are in this bin. So median is in 105-112. Now, the mean is ~112.13, which is higher than the median (around 108.5). So the median is less than the mean. So the correct option is "The median is less than the mean."
Step2: Evaluate the Options
- Option 1: "The media…

Snap & solve any problem in the app
Get step-by-step solutions on Sovi AI
Photo-based solutions with guided steps
Explore more problems and detailed explanations
The median is less than the mean.