QUESTION IMAGE
Question
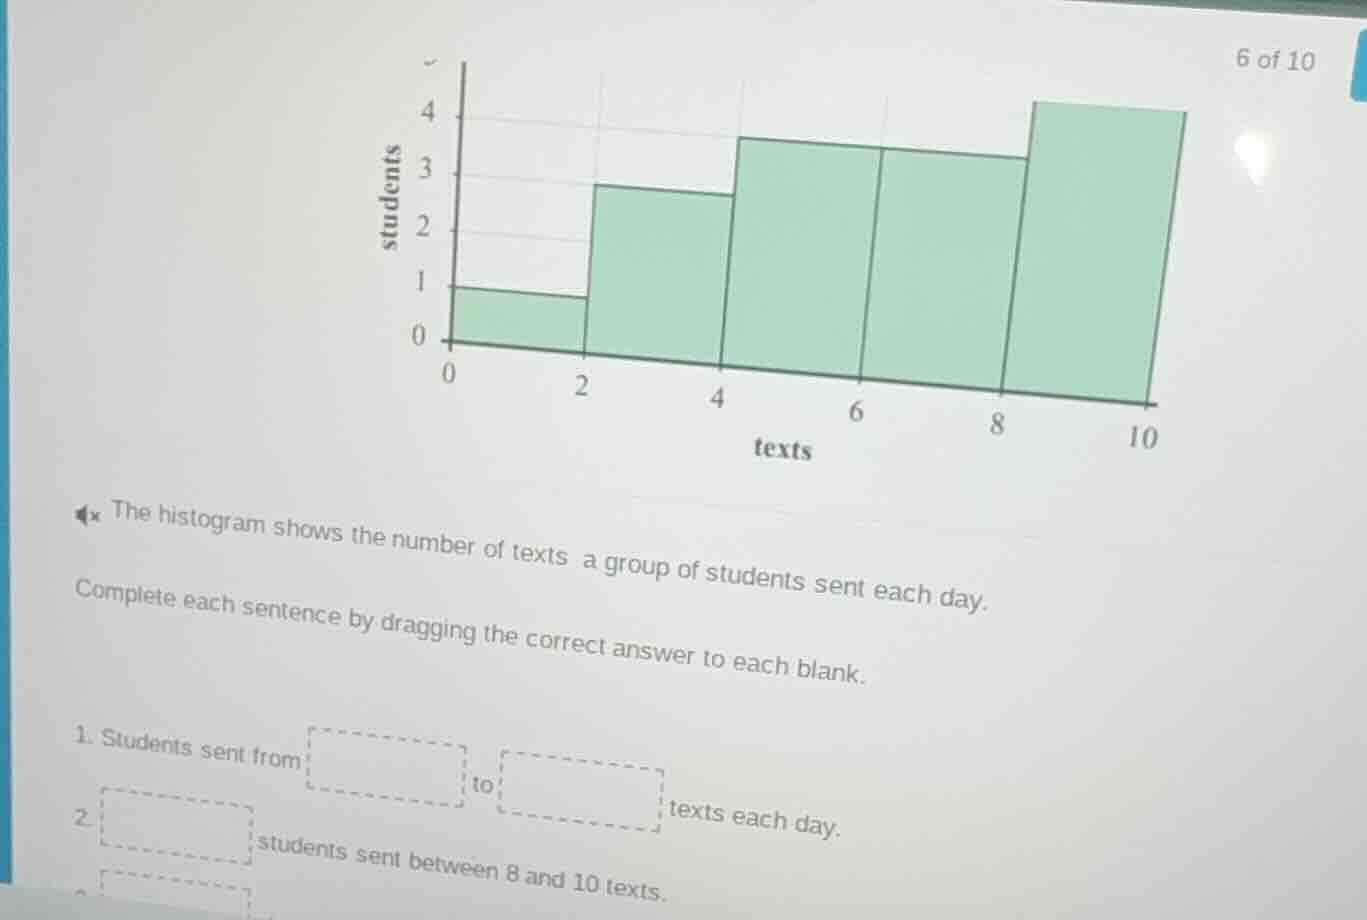
the histogram shows the number of texts a group of students sent each day. complete each sentence by dragging the correct answer to each blank. 1. students sent from to texts each day. 2. students sent between 8 and 10 texts.
Step1: Identify text range
The histogram's x-axis spans from 0 to 10, so this is the full range of texts sent.
Step2: Find 8-10 text count
Look at the bar for 8-10 texts; its height is 4 students.

Snap & solve any problem in the app
Get step-by-step solutions on Sovi AI
Photo-based solutions with guided steps
Explore more problems and detailed explanations
- Students sent from $\boldsymbol{0}$ to $\boldsymbol{10}$ texts each day.
- $\boldsymbol{4}$ students sent between 8 and 10 texts.