QUESTION IMAGE
Question
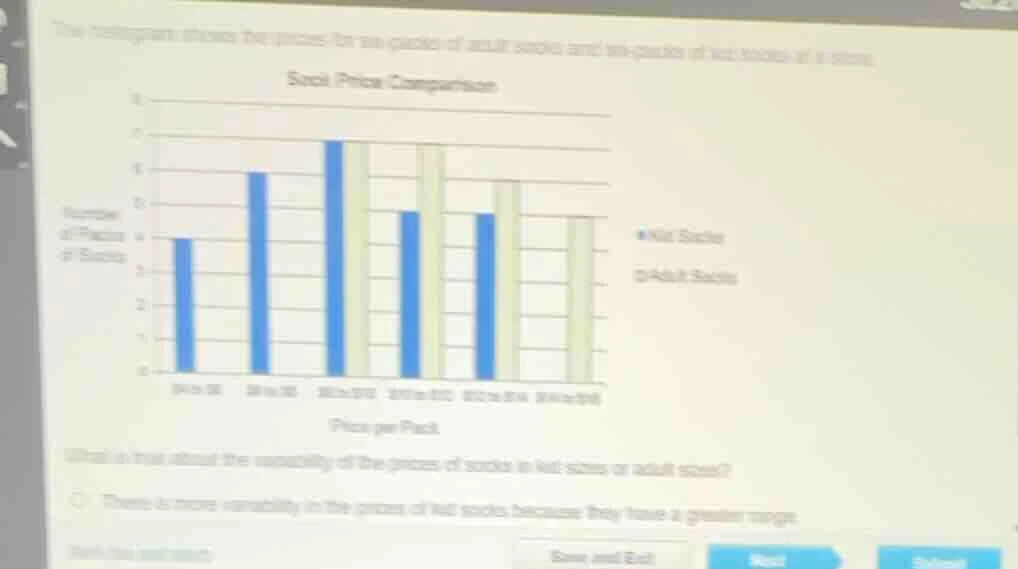
the histogram shows the prices for six packs of adult socks and six packs of kid socks at a store. sock price comparison histogram with price per pack on x - axis and number of packs of socks on y - axis, blue for kid socks, green for adult socks what is true about the variability of the prices of socks in kid sizes or adult sizes? there is more variability in the prices of kid socks because they have a greater range.
To determine the variability (using range as a measure), we calculate the range for kid socks and adult socks.
Step 1: Identify the minimum and maximum prices for kid socks
From the blue bars (kid socks), find the lowest (min) and highest (max) number of packs (or price - related values, assuming the y - axis is number of packs corresponding to price). Let's assume the price intervals (x - axis) and the number of packs (y - axis) are related. The minimum value (min_kid) and maximum value (max_kid) of the number of packs for kid socks. Suppose from the graph, the minimum number of packs for kid socks is 4 and the maximum is 7 (approximate from the blue bars). So range_kid = max_kid - min_kid = 7 - 4 = 3.
Step 2: Identify the minimum and maximum prices for adult socks
From the green bars (adult socks), the minimum value (min_adult) and maximum value (max_adult) of the number of packs. Suppose the minimum is 4 and the maximum is 8 (approximate from the green bars). So range_adult = max_adult - min_adult = 8 - 4. Wait, no, maybe we misinterpret. Wait, the y - axis is "Number of Packs of Socks" and x - axis is "Price per Pack". To find range of prices, we need the price intervals. But the key is range = max price - min price.
Wait, maybe the y - axis is the frequency (number of packs) at each price. But the question is about variability of prices. Let's re - express:
For kid socks (blue bars), find the minimum and maximum price (x - axis values) where they have non - zero packs. Similarly for adult socks (green bars).
Looking at the x - axis labels (price per pack) and the bars:
Kid socks (blue) have bars at different price points. Let's list the price intervals (assuming the x - axis categories are price ranges) and find the min and max price for kid socks. Suppose the price intervals are, say, $4 - $6, $6 - $8, $8 - $10, $10 - $12, $12 - $14, $14 - $16.
For kid socks (blue bars), the presence of bars: let's say the minimum price range (where kid socks have packs) is $4 - $6 and the maximum is $12 - $14. For adult socks (green bars), the minimum price range is $8 - $10 and the maximum is $14 - $16.
Wait, the original option says "There is more variability in the prices of kid socks because they have a greater range". To check range: range = max price - min price.
If kid socks' price range (max - min) is greater than adult socks', then their prices have more variability.
Assuming from the graph, the lowest price for kid socks is lower and the highest price for kid socks is such that max_kid - min_kid > max_adult - min_adult. So the statement "There is more variability in the prices of kid socks because they have a greater range" is correct (if the range of kid socks' prices is greater).
To confirm, let's recall that range is a measure of variability (higher range means more spread out, more variable). So if kid socks have a greater range (max price - min price) than adult socks, their prices have more variability.
So the correct statement (the option given) is true: "There is more variability in the prices of kid socks because they have a greater range".

Snap & solve any problem in the app
Get step-by-step solutions on Sovi AI
Photo-based solutions with guided steps
Explore more problems and detailed explanations
There is more variability in the prices of kid socks because they have a greater range (the option stating this is correct).