QUESTION IMAGE
Question
homework: section 2.4
score: 6.8/9 answered: 7/9
question 7
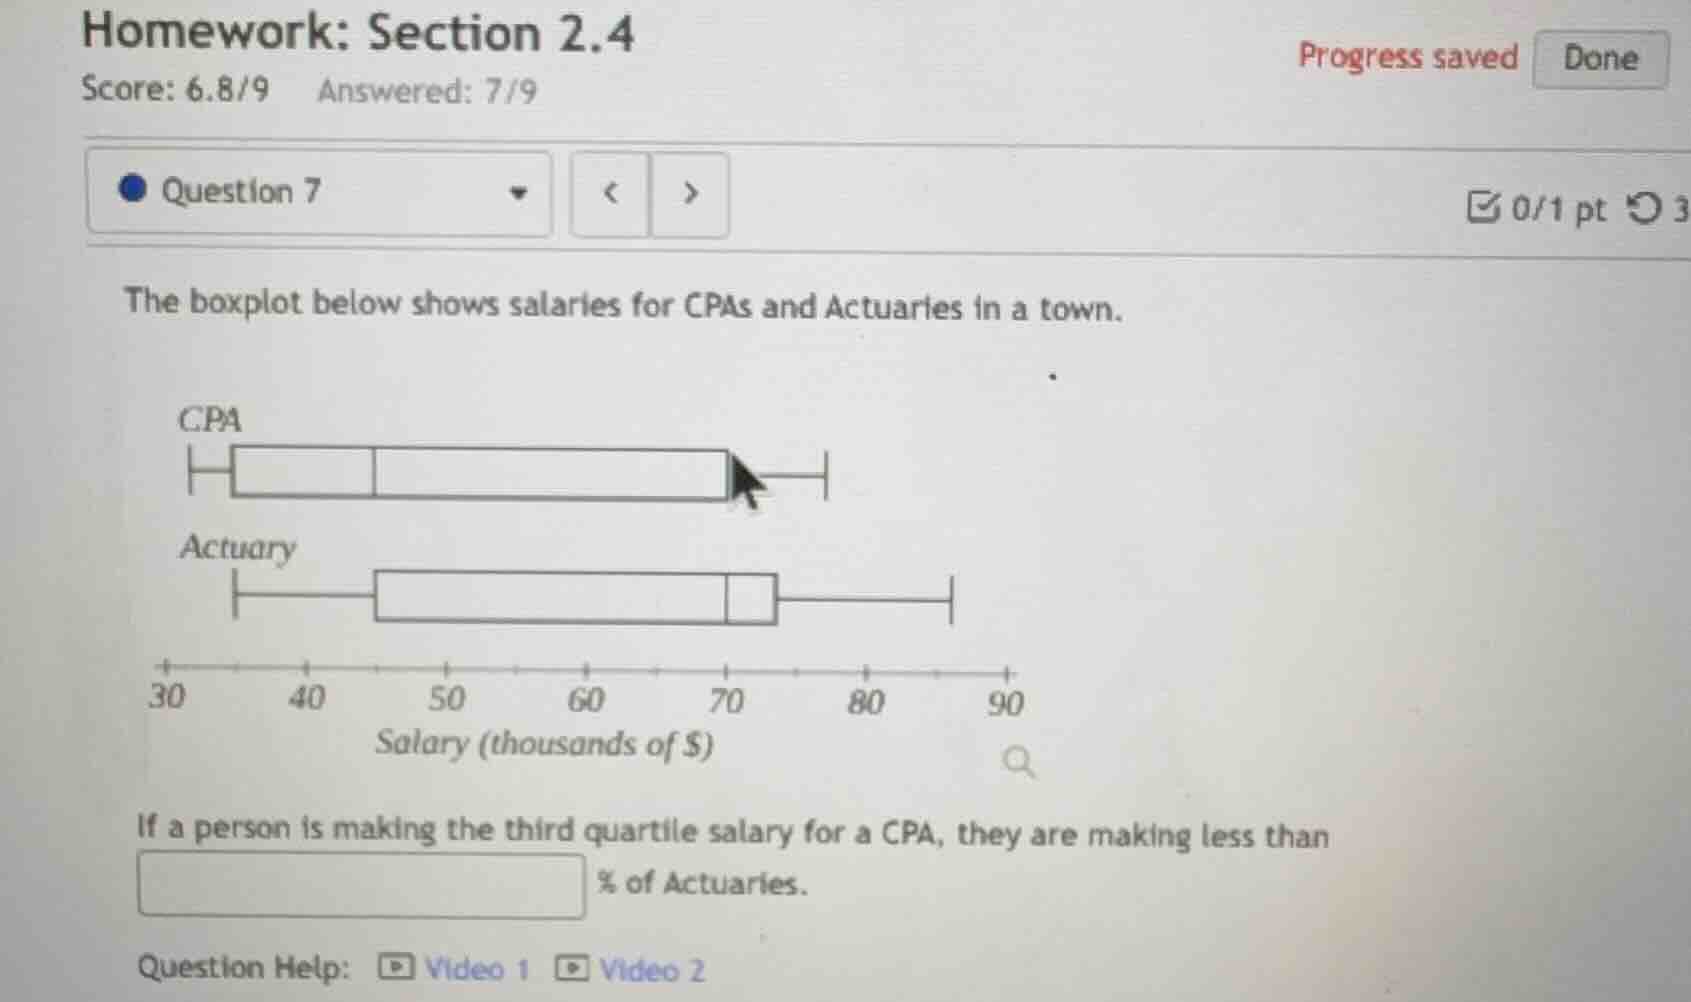
the boxplot below shows salaries for cpas and actuaries in a town.
(boxplot image omitted)
if a person is making the third quartile salary for a cpa, they are making less than
% of actuaries.
question help: video 1 video 2
Step1: Identify CPA Q3 salary
From the boxplot, the third quartile (Q3) for CPAs is $70,000.
Step2: Locate value on Actuary plot
The $70,000 mark aligns with the median (second quartile, Q2) of the Actuary boxplot.
Step3: Calculate percentage above Q2
In a boxplot, 50% of data lies above the median.

Snap & solve any problem in the app
Get step-by-step solutions on Sovi AI
Photo-based solutions with guided steps
Explore more problems and detailed explanations
50