QUESTION IMAGE
Question
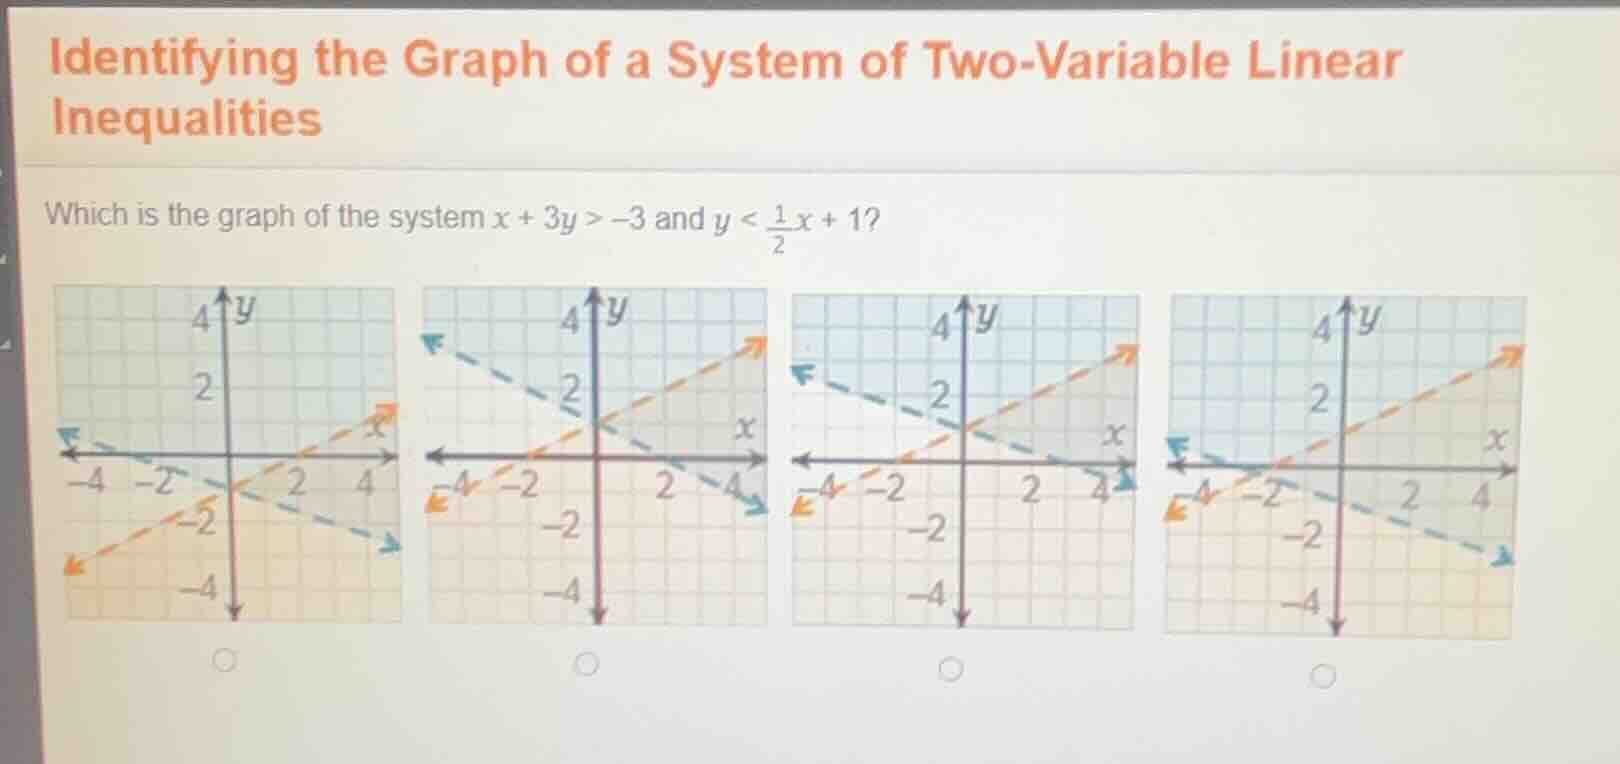
identifying the graph of a system of two - variable linear inequalities
which is the graph of the system (x + 3y > - 3) and (y < \frac{1}{2}x + 1)?
Step1: Rewrite first inequality to slope-intercept
Rearrange $x + 3y > -3$ to solve for $y$:
$3y > -x - 3$
$y > -\frac{1}{3}x - 1$
This is a dashed line with slope $-\frac{1}{3}$, y-intercept $-1$, shading above the line.
Step2: Analyze second inequality
The inequality $y < \frac{1}{2}x + 1$ is already in slope-intercept form:
It is a dashed line with slope $\frac{1}{2}$, y-intercept $1$, shading below the line.
Step3: Match to correct graph
Find the graph with:
- Dashed line $y = -\frac{1}{3}x - 1$ (shaded above)
- Dashed line $y = \frac{1}{2}x + 1$ (shaded below)
The overlapping shaded region is the solution set, which corresponds to the third graph (left-to-right).

Snap & solve any problem in the app
Get step-by-step solutions on Sovi AI
Photo-based solutions with guided steps
Explore more problems and detailed explanations
The third graph (left-to-right: the one with overlapping shading in the upper-right/center area, bounded by the two dashed lines)