QUESTION IMAGE
Question
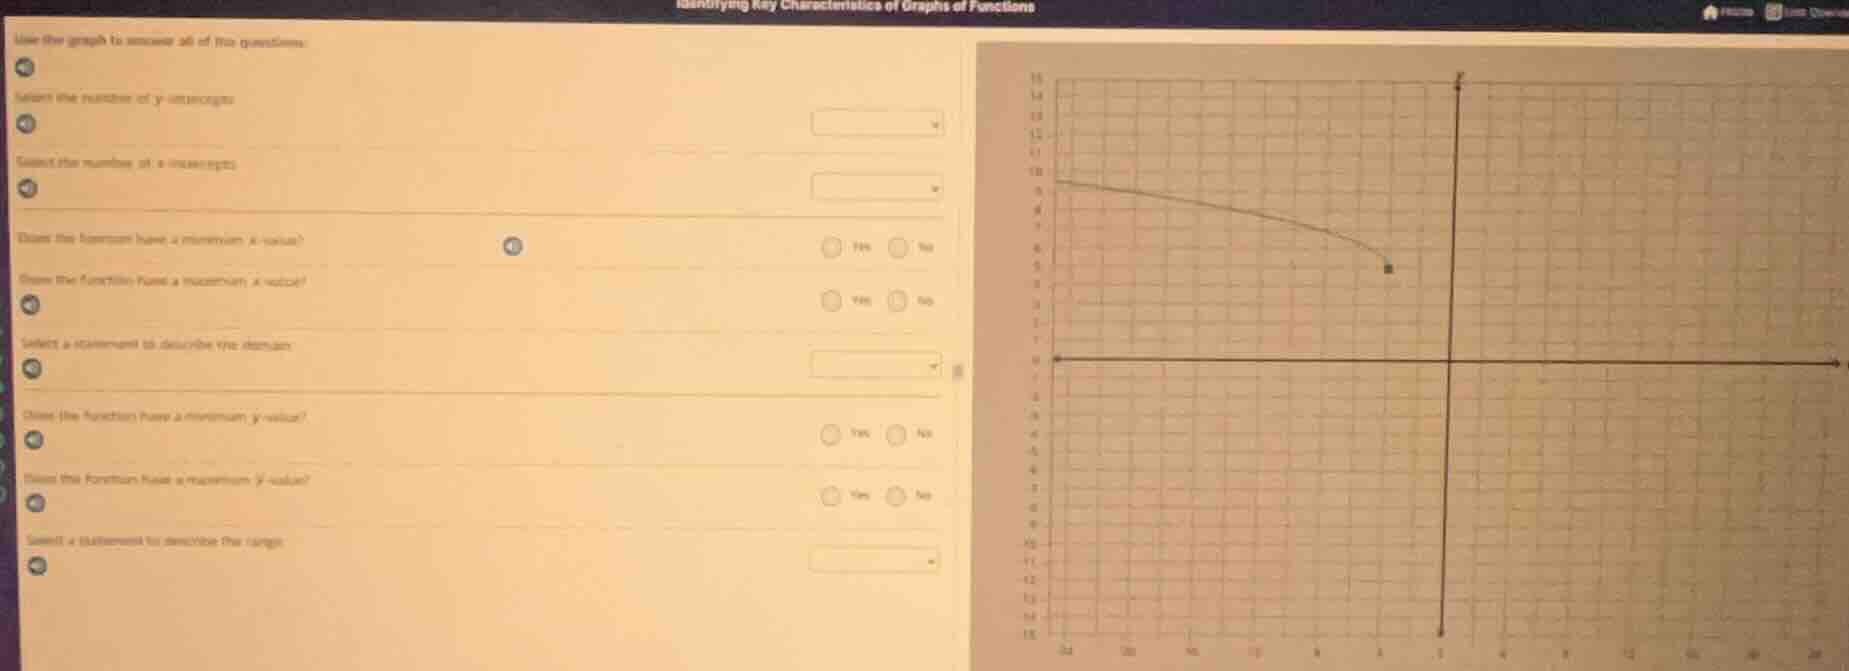
identifying key characteristics of graphs of functions
use the graph to answer all of the questions.
select the number of y - intercepts
select the number of x - intercepts
does the function have a minimum x - value? ● yes ● no
does the function have a maximum x - value? ● yes ● no
select a statement to describe the domain
does the function have a minimum y - value? ● yes ● no
does the function have a maximum y - value? ● yes ● no
select a statement to describe the range
1. Number of y - intercepts
Step1: Recall y - intercept definition
A y - intercept is a point where the graph intersects the y - axis (where \(x = 0\)). Looking at the graph, we check if there is a point with \(x=0\). From the graph, we can see that there is 1 point where the graph intersects the y - axis.
Step1: Recall x - intercept definition
An x - intercept is a point where the graph intersects the x - axis (where \(y = 0\)). Looking at the graph, we check if there is a point with \(y = 0\). From the graph, we can see that there is 1 point where the graph intersects the x - axis.
Step1: Analyze the domain (x - values)
Looking at the graph, the x - values seem to start from a certain point (the left - most point) and go towards \(x = 0\) (and maybe beyond, but from the visible part, the left - most x - value is a specific number, but since the graph has a left - most point, the x - values have a minimum (the smallest x - value on the graph). Wait, no, looking at the x - axis labels, the left - most x - value is around \(x=- 14\) or so? Wait, no, the graph on the left: the x - axis has negative values on the left. Wait, actually, the graph of the curve: the x - values of the curve start from a left - most point (the left - most x - coordinate) and go towards \(x = 0\). But the other part (the horizontal line) is at \(y = 0\) from \(x = 0\) to the right? Wait, no, the horizontal line is at \(y = 0\) starting from \(x = 0\) and going to the right? Wait, no, the graph: the upper curve is from the left (negative x - values) towards \(x = 0\), and the lower horizontal line is from \(x = 0\) to the right (positive x - values) at \(y = 0\). Wait, for the function (the combination of the curve and the line), the x - values of the curve start from a left - most x - value (the smallest x - value on the curve). But does the function have a minimum x - value? The curve has a left - most point, so the x - values of the curve have a minimum. But the horizontal line starts at \(x = 0\) and goes to the right. But the function is the combination? Wait, maybe the function is the union of the curve and the horizontal line? Wait, no, maybe it's a piece - wise function. But from the graph, the curve is on the left (negative x - values) and the horizontal line is on the right (non - negative x - values). The curve has a left - most x - value (the smallest x - value for the curve), so the function (the entire graph) has a minimum x - value (the left - most x - value of the curve). Wait, but maybe I made a mistake. Wait, the x - axis: the left - most x - value on the graph (the curve) is a specific number, so the x - values of the function have a minimum (the smallest x - value). So the answer is Yes? Wait, no, wait the curve: the x - values of the curve are from, say, \(x=-14\) (or whatever the left - most x is) up to \(x = 0\), and the horizontal line is from \(x = 0\) to \(x=\infty\) (or as far as the graph shows). So the x - values of the function (the entire graph) have a minimum x - value (the left - most x of the curve). So the answer is Yes.

Snap & solve any problem in the app
Get step-by-step solutions on Sovi AI
Photo-based solutions with guided steps
Explore more problems and detailed explanations
1