QUESTION IMAGE
Question
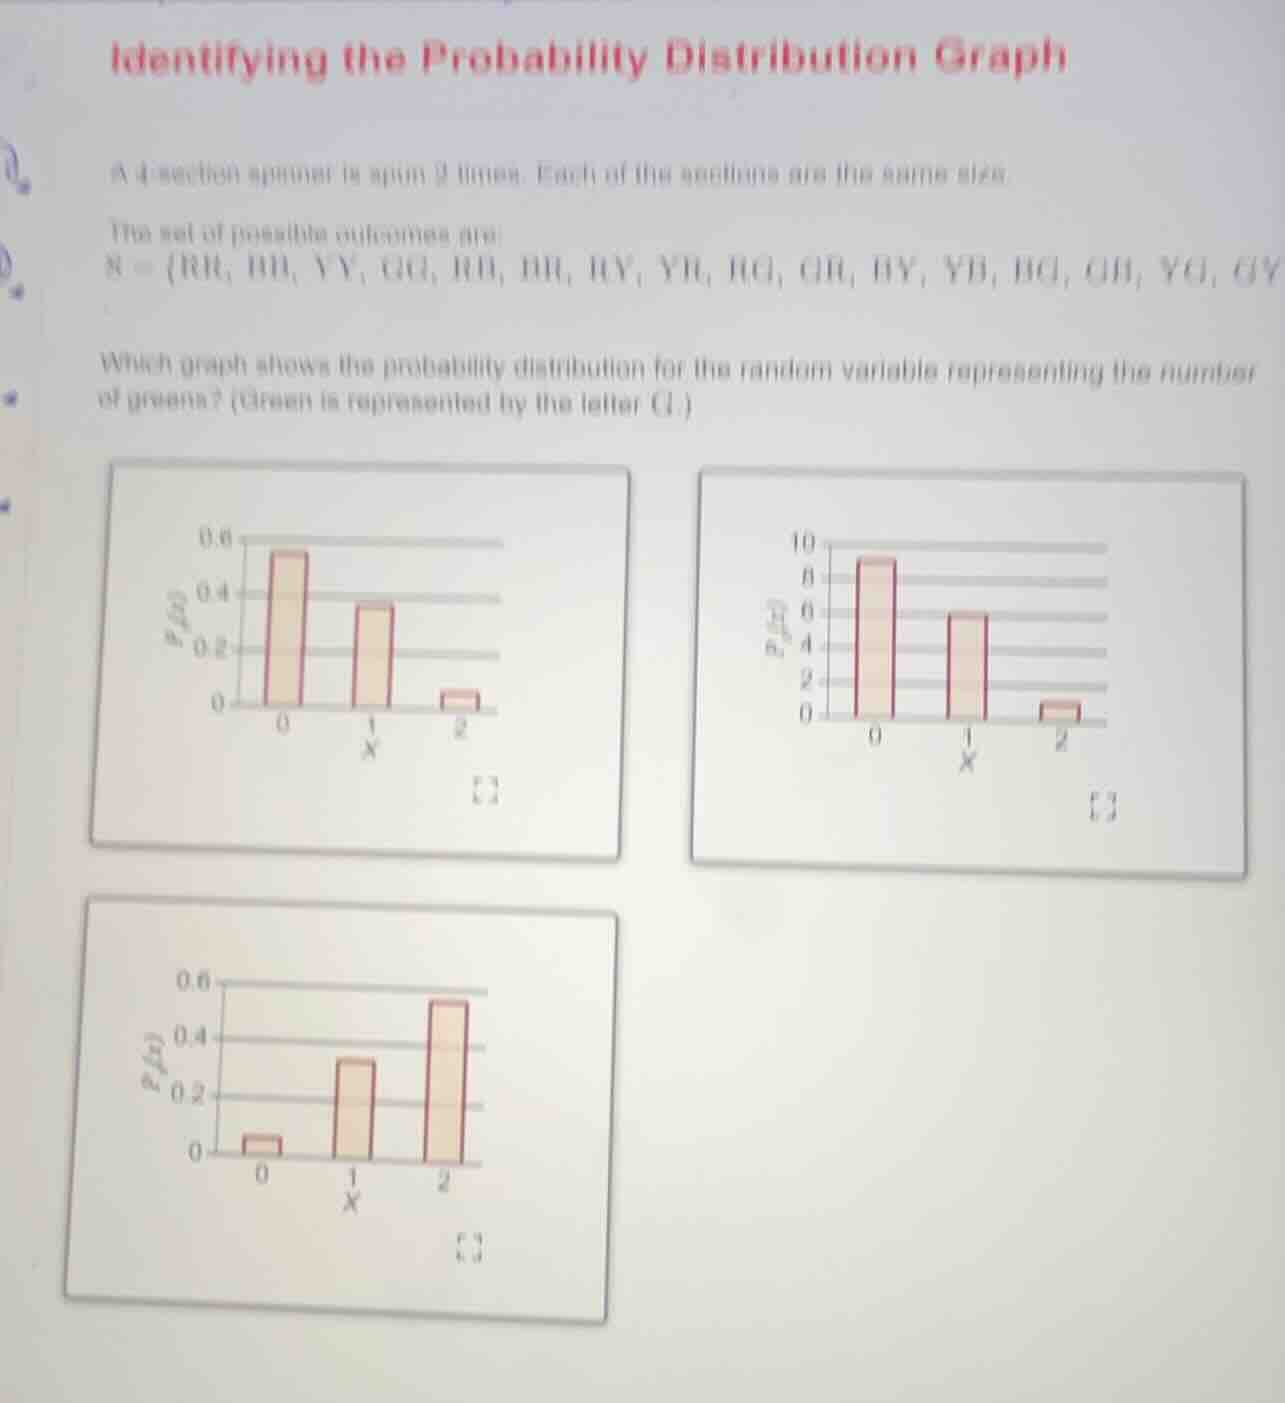
identifying the probability distribution graph
a 4 - section spinner is spun 2 times. each of the sections are the same size.
the set of possible outcomes are:
s = {rr, bb, yy, gg, rb, br, ry, yr, rg, gr, by, yb, bg, gb, yg, gy}
which graph shows the probability distribution for the random variable representing the number of greens? (green is represented by the letter g.)
three bar graphs are shown, with x - axis labeled x (values 0, 1, 2) and y - axis labeled p(x) or frequency. the first graph has y - axis from 0 to 0.6, the second from 0 to 10, and the third from 0 to 0.6.
Step1: Count outcomes for each X
First, we identify the number of greens (X) in each outcome:
- X=0 (no G): Outcomes are RR, BB, YY, RB, BR, RY, YR, BY, YB. That's 9? Wait, wait, the sample space S: Let's list all. Wait the given S: {RR, BB, YY, GG, RB, BR, RY, YR, RG, GR, BY, YB, BG, GB, YG, GY}. Wait I missed some. Let's count correctly:
Total outcomes: Let's count the elements in S. The set is written as: RR, BB, YY, GG, RB, BR, RY, YR, RG, GR, BY, YB, BG, GB, YG, GY. Wait that's 16 elements? Wait the original problem says a 4 - section spinner (R, B, Y, G) spun 2 times. So total possible outcomes are 4×4 = 16, which matches the size of S. Good.
Now, count X (number of Gs):
- X=0: Outcomes with no G. So letters are R, B, Y. So first and second spin: (R,R), (B,B), (Y,Y), (R,B), (B,R), (R,Y), (Y,R), (B,Y), (Y,B). Let's count: RR, BB, YY, RB, BR, RY, YR, BY, YB. That's 9? Wait no, 4 choices for first, 4 for second. No G: 3 choices (R,B,Y) for each spin. So 3×3 = 9. Correct.
- X=1: Outcomes with exactly one G. So either first spin G and second not, or second spin G and first not.
First spin G, second not: G with R, B, Y: GR, GB, GY.
Second spin G, first not: R with G, B with G, Y with G: RG, BG, YG.
So total X=1: GR, GB, GY, RG, BG, YG. Wait that's 6? Wait 3 (first G) + 3 (second G) = 6. Correct. Because for exactly one G: (G, non - G) or (non - G, G). Non - G: 3 choices (R,B,Y), so 3 + 3 = 6.
- X=2: Outcomes with two Gs: GG. Only 1 outcome (G,G).
Wait wait, wait: X=2: GG. So that's 1.
Wait but 9 (X=0) + 6 (X=1) + 1 (X=2) = 16, which matches total outcomes. Good.
Now, probabilities:
- P(X=0) = 9/16 ≈ 0.5625? Wait no, wait 9/16 is 0.5625? Wait no, 9 divided by 16 is 0.5625? Wait but the first graph has X=0 bar at ~0.6, X=1 at ~0.375 (6/16 = 0.375), X=2 at 1/16 = 0.0625. Wait the first graph: X=0 bar ~0.6 (close to 9/16=0.5625? Wait maybe my counting was wrong. Wait wait, 4 sections: R, B, Y, G. So when spinning twice, total outcomes 4×4=16.
X=0: no G. So each spin: 3 options (R,B,Y). So 3×3=9. So P(X=0)=9/16=0.5625≈0.6.
X=1: exactly one G. So (G, non - G) or (non - G, G). Non - G: 3 options, so 3 (G, non - G) + 3 (non - G, G)=6. So P(X=1)=6/16=0.375≈0.4? Wait no, 6/16=0.375, which is close to 0.4.
X=2: two Gs: (G,G). So 1/16=0.0625≈0.06.
Now look at the graphs:
First graph: X=0 bar ~0.6, X=1 ~0.4, X=2 ~0.06. Which matches the probabilities (9/16≈0.5625≈0.6, 6/16=0.375≈0.4, 1/16≈0.06).
Second graph: Y - axis is frequency (counts), not probability. X=0: 9, X=1:6, X=2:1. But the question is about probability distribution, so Y - axis should be probability (0 - 1), not count (0 - 10). So second graph is frequency, not probability.
Third graph: X=0 bar is small, X=1 and X=2 are big, which is wrong.
So the first graph (with Y - axis 0 - 0.6, X=0 ~0.6, X=1 ~0.4, X=2 ~0.06) is the probability distribution.
Wait but let's confirm the counts again:
Total outcomes: 16.
X=0: 9 (no G), X=1: 6 (one G), X=2:1 (two Gs).
Probabilities:
P(X=0)=9/16=0.5625≈0.6,
P(X=1)=6/16=0.375≈0.4,
P(X=2)=1/16=0.0625≈0.06.
Which matches the first graph's bar heights: X=0 ~0.6, X=1 ~0.4, X=2 ~0.06.
Step2: Analyze the graphs
- First graph: Y - axis is probability (0 - 0.6), X=0 bar ~0.6, X=1 ~0.4, X=2 ~0.06. Matches our calculated probabilities.
- Second graph: Y - axis is frequency (counts: 0 - 10), X=0:9, X=1:6, X=2:1. But the question asks for probability distribution, so Y - axis should be probability, not frequency. So second graph is incorrect.
- Third graph: X=0 bar is small, X=1 and X=2 are big, which is opposite of our counts (X=0 should be biggest,…

Snap & solve any problem in the app
Get step-by-step solutions on Sovi AI
Photo-based solutions with guided steps
Explore more problems and detailed explanations
The first graph (with Y - axis labeled P(X) from 0 to 0.6, X=0 bar ~0.6, X=1 ~0.4, X=2 ~0.06)