QUESTION IMAGE
Question
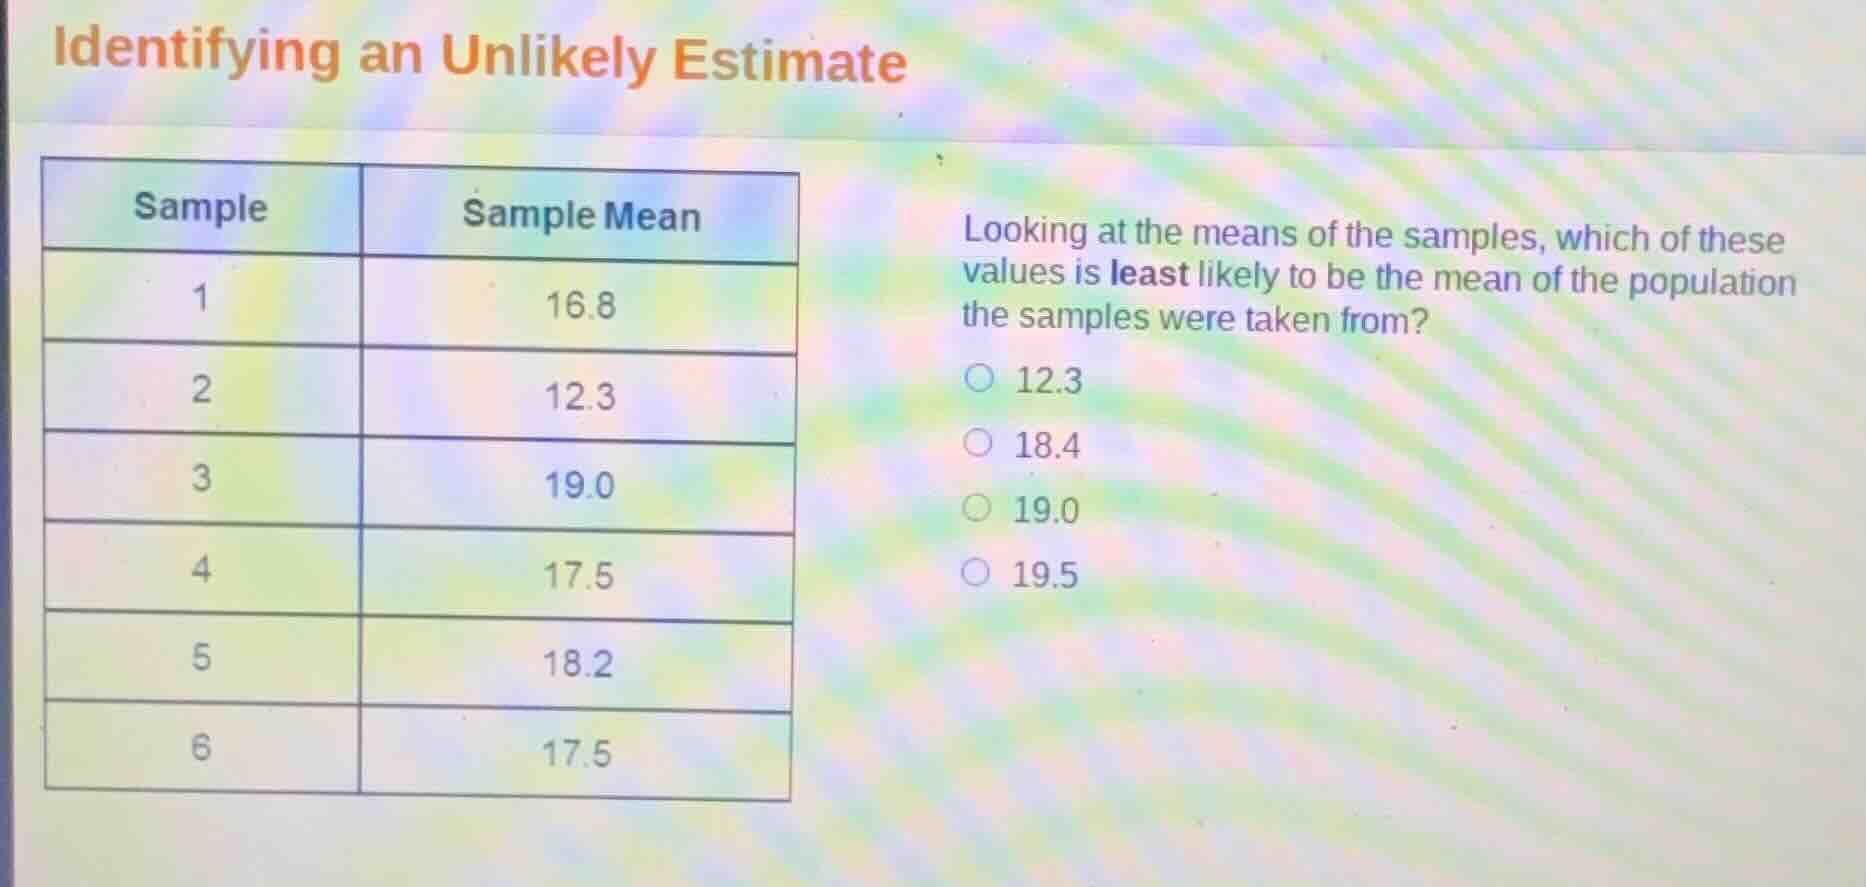
identifying an unlikely estimate
sample | sample mean
1 | 16.8
2 | 12.3
3 | 19.0
4 | 17.5
5 | 18.2
6 | 17.5
looking at the means of the samples, which of these values is least likely to be the mean of the population the samples were taken from?
12.3
18.4
19.0
19.5
Step1: Calculate mean of sample means
First, sum all sample means: $16.8 + 12.3 + 19.0 + 17.5 + 18.2 + 17.5 = 101.3$
Then divide by number of samples: $\frac{101.3}{6} \approx 16.88$
Step2: Find value farthest from sample mean average
Calculate absolute differences:
- $|12.3 - 16.88| = 4.58$
- $|18.4 - 16.88| = 1.52$
- $|19.0 - 16.88| = 2.12$
- $|19.5 - 16.88| = 2.62$
The largest difference is for 12.3.

Snap & solve any problem in the app
Get step-by-step solutions on Sovi AI
Photo-based solutions with guided steps
Explore more problems and detailed explanations
12.3