QUESTION IMAGE
Question
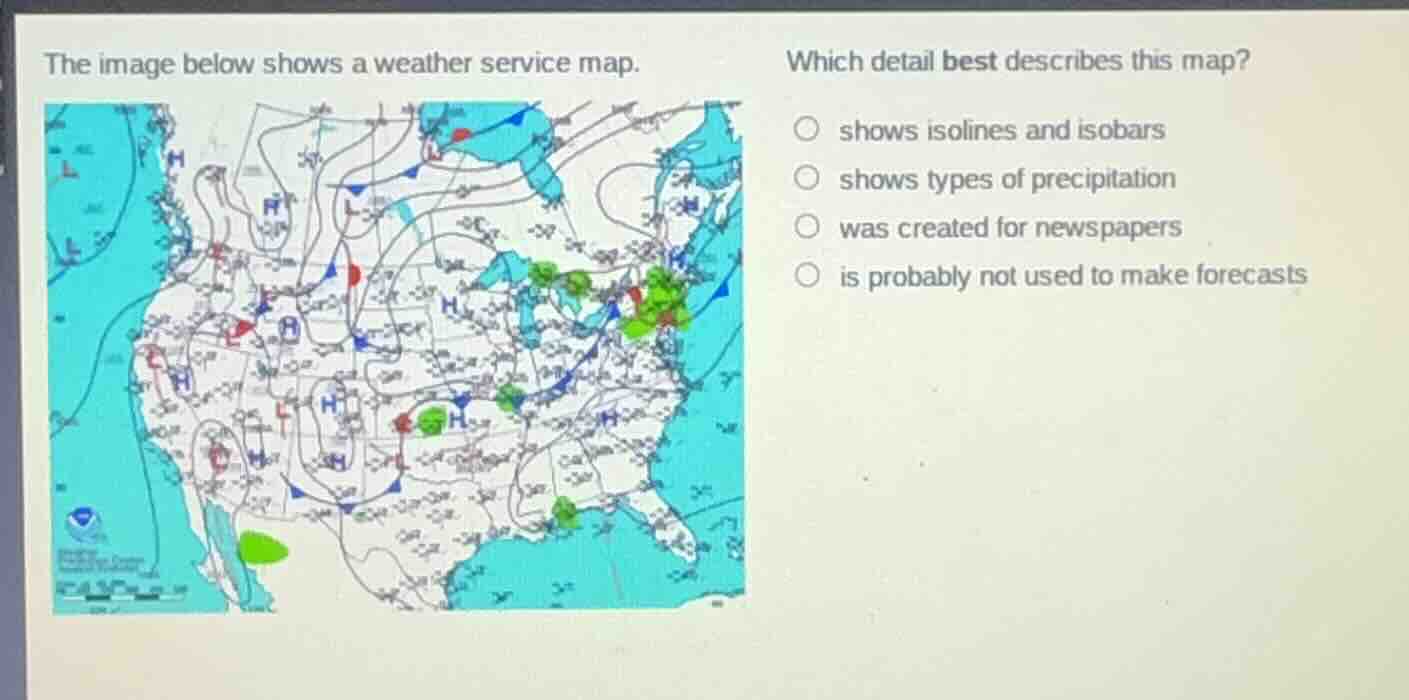
the image below shows a weather service map. which detail best describes this map?
○ shows isolines and isobars
○ shows types of precipitation
○ was created for newspapers
○ is probably not used to make forecasts
Brief Explanations
- Isolines (general term for lines connecting equal-value points) and isobars (lines of equal atmospheric pressure, marked with "H" for high pressure here) are clearly visible as the curved lines across the map.
- The map does not differentiate specific precipitation types, only general shaded areas.
- This is a professional National Weather Service map, not simplified for newspapers.
- Such maps are core tools for creating weather forecasts.

Snap & solve any problem in the app
Get step-by-step solutions on Sovi AI
Photo-based solutions with guided steps
Explore more problems and detailed explanations
shows isolines and isobars