QUESTION IMAGE
Question
incorrect
2 tries left. please try again.
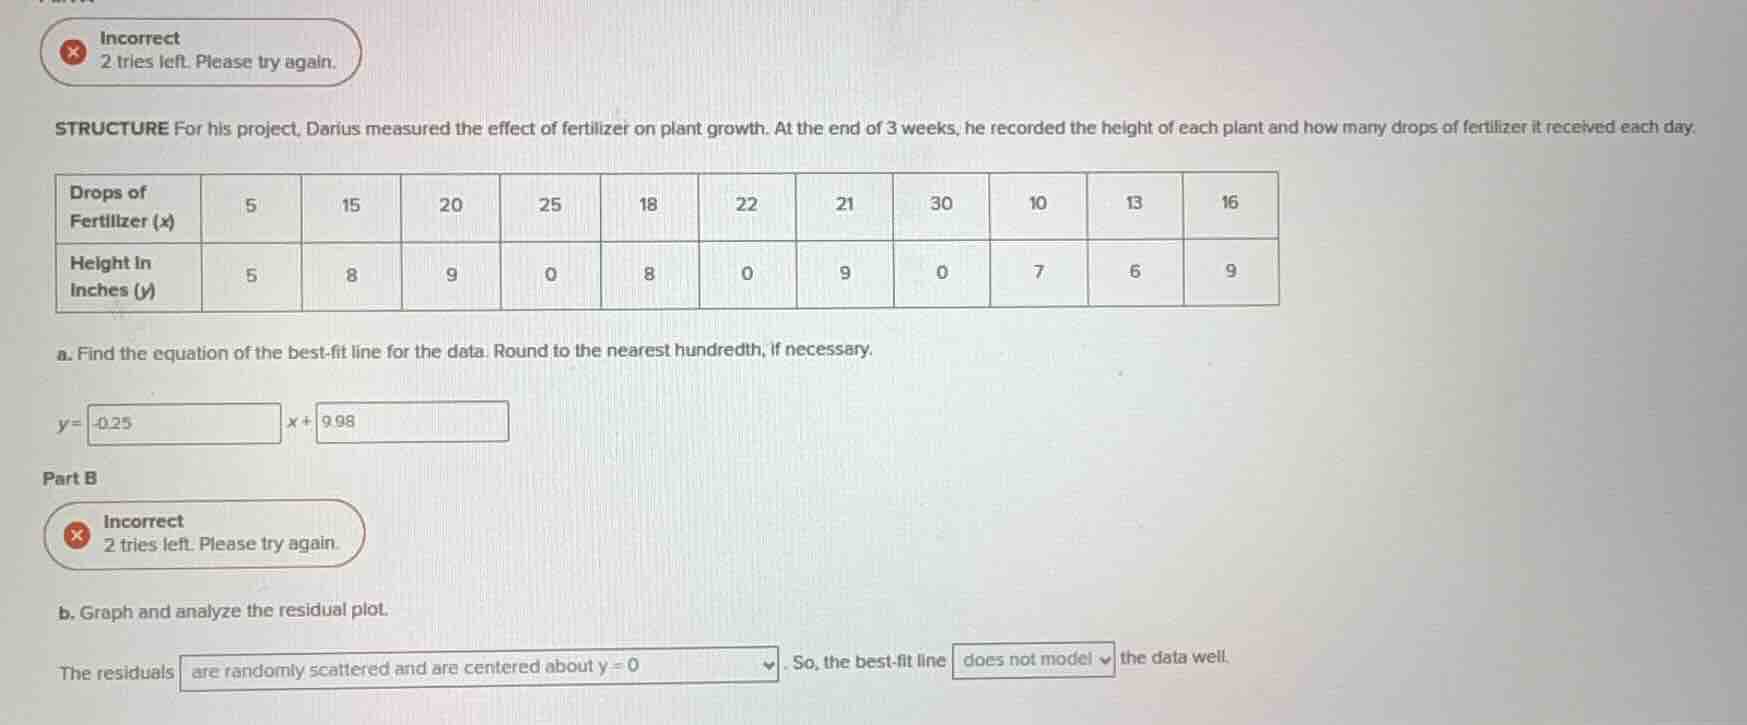
structure for his project, darius measured the effect of fertilizer on plant growth. at the end of 3 weeks, he recorded the height of each plant and how many drops of fertilizer it received each day.
| drops of fertilizer (x) | 5 | 15 | 20 | 25 | 18 | 22 | 21 | 30 | 10 | 13 | 16 |
|---|
a. find the equation of the best - fit line for the data. round to the nearest hundredth, if necessary.
y = -0.25 x + 9.98
part b
incorrect
2 tries left. please try again.
b. graph and analyze the residual plot.
the residuals are randomly scattered and are centered about y = 0. so, the best - fit line does not model the data well.
Step1: Calculate $\bar{x}$ and $\bar{y}$
First, find the mean of $x$ (fertilizer drops) and $y$ (plant height):
$\bar{x} = \frac{5+15+20+25+18+22+21+30+10+13+16}{11} = \frac{195}{11} \approx 17.73$
$\bar{y} = \frac{5+8+9+0+8+0+9+0+7+6+9}{11} = \frac{61}{11} \approx 5.55$
Step2: Calculate slope $m$
Use the formula $m = \frac{\sum_{i=1}^{n}(x_i-\bar{x})(y_i-\bar{y})}{\sum_{i=1}^{n}(x_i-\bar{x})^2}$:
Numerator:
$(5-17.73)(5-5.55)+(15-17.73)(8-5.55)+(20-17.73)(9-5.55)+(25-17.73)(0-5.55)+(18-17.73)(8-5.55)+(22-17.73)(0-5.55)+(21-17.73)(9-5.55)+(30-17.73)(0-5.55)+(10-17.73)(7-5.55)+(13-17.73)(6-5.55)+(16-17.73)(9-5.55)$
$= (-12.73)(-0.55)+(-2.73)(2.45)+(2.27)(3.45)+(7.27)(-5.55)+(0.27)(2.45)+(4.27)(-5.55)+(3.27)(3.45)+(12.27)(-5.55)+(-7.73)(1.45)+(-4.73)(0.45)+(-1.73)(3.45)$
$\approx 7.00 - 6.69 + 7.83 - 40.35 + 0.66 - 23.70 + 11.28 - 68.10 - 11.21 - 2.13 - 5.97 \approx -121.38$
Denominator:
$(5-17.73)^2+(15-17.73)^2+(20-17.73)^2+(25-17.73)^2+(18-17.73)^2+(22-17.73)^2+(21-17.73)^2+(30-17.73)^2+(10-17.73)^2+(13-17.73)^2+(16-17.73)^2$
$= 162.05 + 7.45 + 5.15 + 52.85 + 0.07 + 18.23 + 10.69 + 150.55 + 59.75 + 22.37 + 2.99 \approx 492.10$
$m = \frac{-121.38}{492.10} \approx -0.25$
Step3: Calculate y-intercept $b$
Use $b = \bar{y} - m\bar{x}$:
$b = 5.55 - (-0.25)(17.73) = 5.55 + 4.43 = 9.98$
Step4: Analyze residual plot pattern
First, calculate residuals ($\text{Residual} = y - \hat{y}$) for each data point:
- For $x=5$: $\hat{y}=-0.25(5)+9.98=8.73$, residual $=5-8.73=-3.73$
- For $x=15$: $\hat{y}=-0.25(15)+9.98=6.23$, residual $=8-6.23=1.77$
- For $x=20$: $\hat{y}=-0.25(20)+9.98=4.98$, residual $=9-4.98=4.02$
- For $x=25$: $\hat{y}=-0.25(25)+9.98=3.73$, residual $=0-3.73=-3.73$
- For $x=18$: $\hat{y}=-0.25(18)+9.98=5.48$, residual $=8-5.48=2.52$
- For $x=22$: $\hat{y}=-0.25(22)+9.98=4.48$, residual $=0-4.48=-4.48$
- For $x=21$: $\hat{y}=-0.25(21)+9.98=4.73$, residual $=9-4.73=4.27$
- For $x=30$: $\hat{y}=-0.25(30)+9.98=2.48$, residual $=0-2.48=-2.48$
- For $x=10$: $\hat{y}=-0.25(10)+9.98=7.48$, residual $=7-7.48=-0.48$
- For $x=13$: $\hat{y}=-0.25(13)+9.98=6.73$, residual $=6-6.73=-0.73$
- For $x=16$: $\hat{y}=-0.25(16)+9.98=5.98$, residual $=9-5.98=3.02$
Plotting these, the residuals are not randomly scattered: they cluster into positive values for mid-range $x$ and negative values for low/high $x$, forming a U-shape. This means the linear model is not appropriate.

Snap & solve any problem in the app
Get step-by-step solutions on Sovi AI
Photo-based solutions with guided steps
Explore more problems and detailed explanations
a. $y = -0.25x + 9.98$
b. The residuals follow a curved (U-shaped) pattern, not randomly scattered. So, the best-fit line does not model the data well.