QUESTION IMAGE
Question
integrated math 1 - unit 6
name:
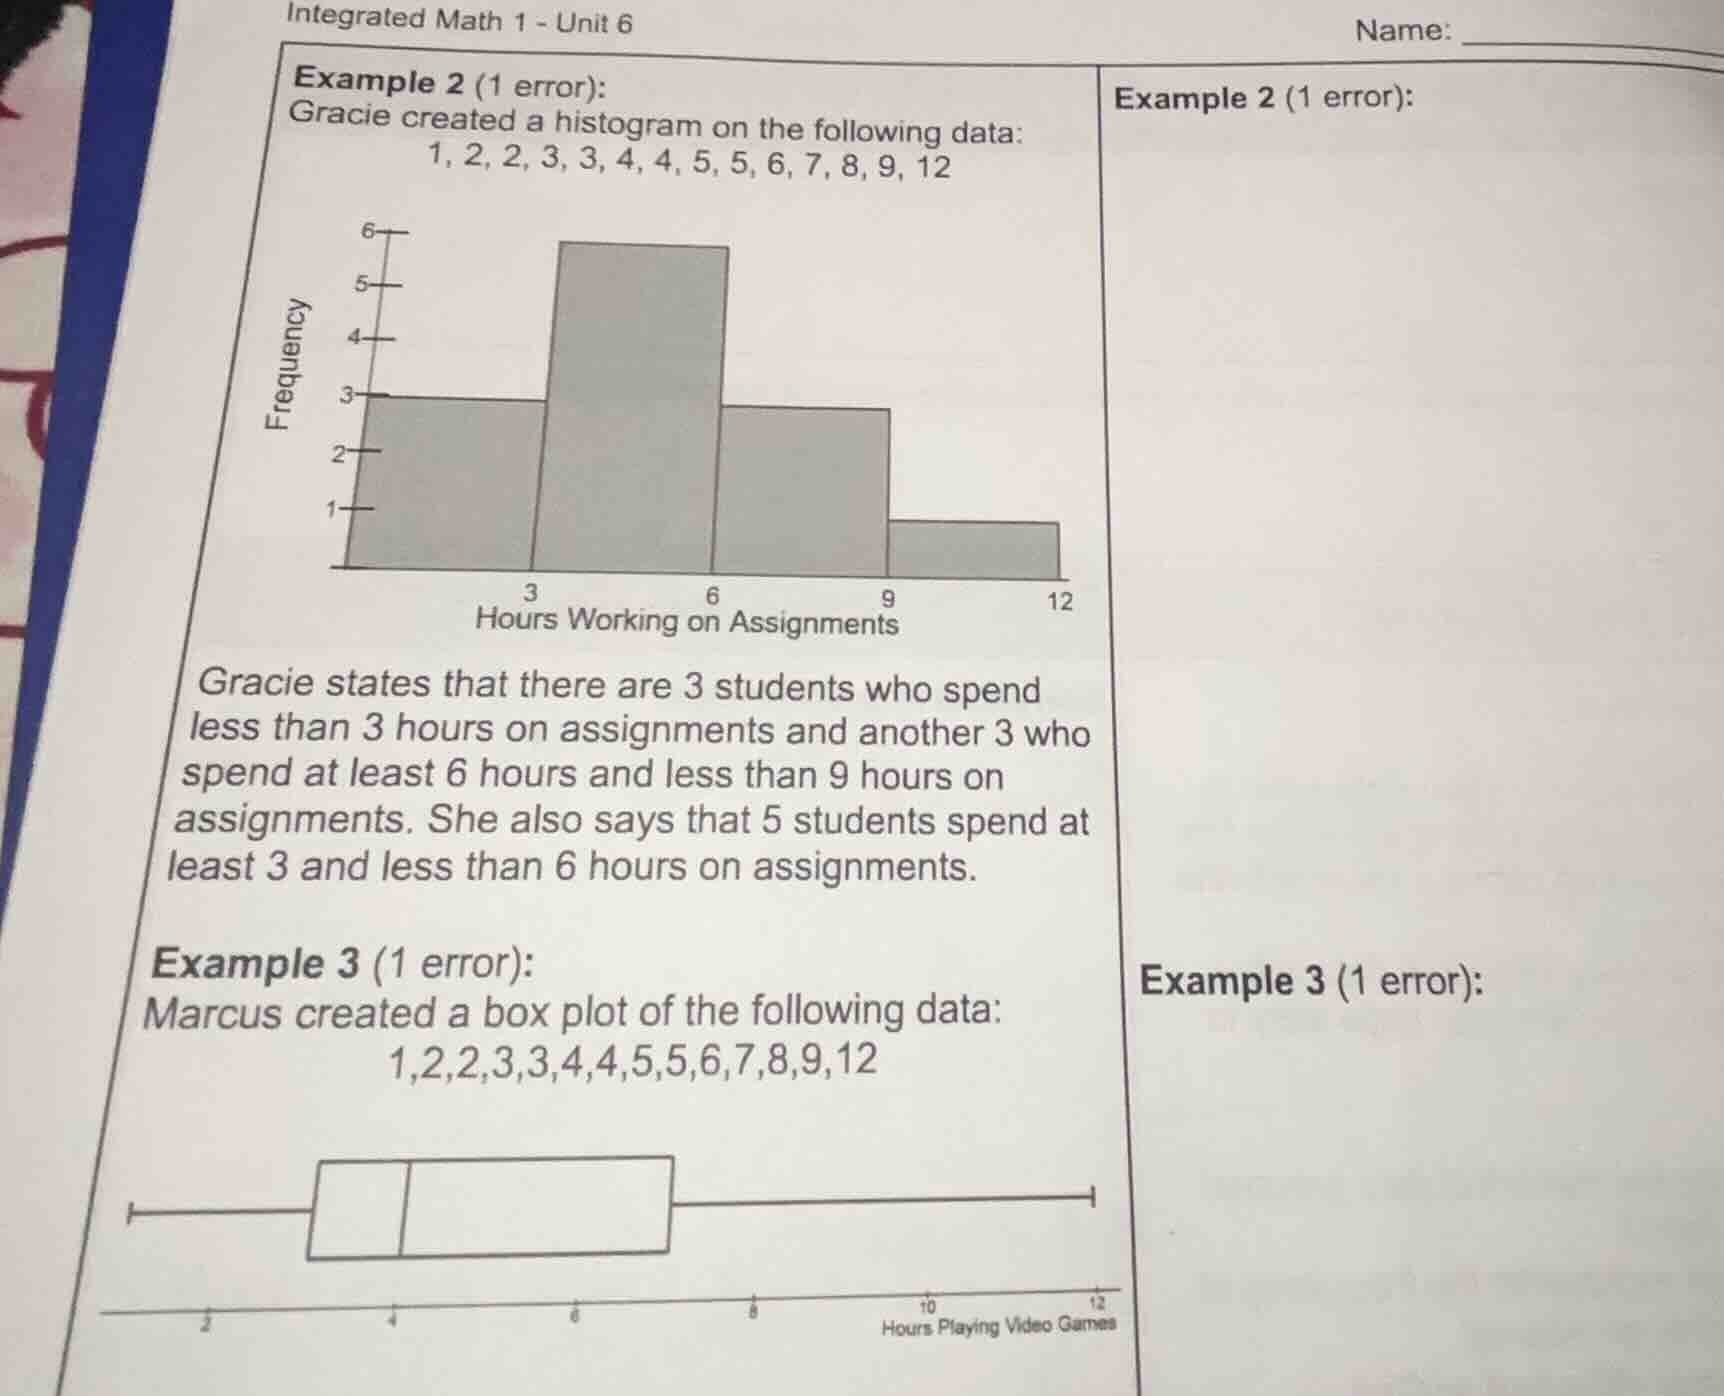
example 2 (1 error):
gracie created a histogram on the following data:
1, 2, 2, 3, 3, 4, 4, 5, 5, 6, 7, 8, 9, 12
gracie states that there are 3 students who spend
less than 3 hours on assignments and another 3 who
spend at least 6 hours and less than 9 hours on
assignments. she also says that 5 students spend at
least 3 and less than 6 hours on assignments.
example 3 (1 error):
marcus created a box plot of the following data:
1,2,2,3,3,4,4,5,5,6,7,8,9,12
Example 2 Analysis:
Step 1: Analyze "less than 3 hours" data
The data points less than 3 are 1, 2, 2. Count: \( 1 + 2 = 3 \)? Wait, 1, 2, 2: that's 3 values? Wait, 1 (1), 2 (2), 2 (3). So 3 values. But wait, the first bar in the histogram is up to 3 (labeled 3 on the x - axis). Wait, no, the x - axis labels are 3, 6, 9, 12. So the first interval is "less than 3" (since the first bar is from, say, 0 - 3), the second is 3 - 6, third 6 - 9, fourth 9 - 12.
Data for 0 - 3: 1, 2, 2. Count: 3. So Gracie's first statement ("3 students who spend less than 3 hours") is correct? Wait, no, wait the data is 1, 2, 2, 3, 3, 4, 4, 5, 5, 6, 7, 8, 9, 12. Wait, 1, 2, 2: that's 3 values. Then 3, 3, 4, 4, 5, 5: that's 6 values (for 3 - 6). Then 6, 7, 8, 9: wait, 6, 7, 8, 9: that's 4 values? Wait, no, the data is 1, 2, 2, 3, 3, 4, 4, 5, 5, 6, 7, 8, 9, 12. Let's list the counts per interval:
- Interval 0 - 3 (less than 3): 1, 2, 2 → count = 3
- Interval 3 - 6 (at least 3, less than 6): 3, 3, 4, 4, 5, 5 → count = 6
- Interval 6 - 9 (at least 6, less than 9): 6, 7, 8 → wait, 6, 7, 8: that's 3 values? Wait, 6, 7, 8, 9: no, 9 is in 9 - 12? Wait, 9 is equal to 9, so the interval 6 - 9 is "at least 6, less than 9", so 6, 7, 8. Wait, the data has 6, 7, 8, 9. Wait, 9 is not less than 9, so 6, 7, 8: that's 3 values? Wait, 6 (1), 7 (2), 8 (3). Then 9 and 12: 9 is in 9 - 12, 12 is in 9 - 12. So interval 6 - 9: 6, 7, 8 → count = 3. Then interval 9 - 12: 9, 12 → count = 2.
Gracie says "another 3 who spend at least 6 hours and less than 9 hours". The data for 6 - 9 is 6, 7, 8 → count = 3. Then "5 students spend at least 3 and less than 6 hours". But the actual count for 3 - 6 is 3, 3, 4, 4, 5, 5 → count = 6. So here's the error: Gracie said 5, but actual is 6. So the error is in the statement about "at least 3 and less than 6 hours" (she said 5, actual is 6) or maybe in the 6 - 9? Wait, no, let's re - check:
Wait, the data points:
- Less than 3: 1, 2, 2 → 3 (correct as per Gracie)
- At least 3 and less than 6: 3, 3, 4, 4, 5, 5 → 6 (Gracie said 5, error here)
- At least 6 and less than 9: 6, 7, 8 → 3 (Gracie said 3, correct)
So the error is in the statement "5 students spend at least 3 and less than 6 hours on assignments" (actual is 6).
Example 3 Analysis (Box - Plot):
Step 1: Find the five - number summary
The data is \( 1, 2, 2, 3, 3, 4, 4, 5, 5, 6, 7, 8, 9, 12 \). There are \( n = 14 \) data points.
- Minimum: 1
- Q1 (first quartile): The median of the first 7 data points (since \( n = 14 \), the first half is data points 1 - 7: \( 1, 2, 2, 3, 3, 4, 4 \)). The median of these 7 is the 4th value: 3.
- Median (Q2): The average of the 7th and 8th values. 7th value: 4, 8th value: 5. Median \(=\frac{4 + 5}{2}=4.5\)
- Q3 (third quartile): The median of the last 7 data points (data points 8 - 14: \( 5, 6, 7, 8, 9, 12 \)? Wait, no, data points 8 - 14: 5 (8th), 6 (9th), 7 (10th), 8 (11th), 9 (12th), 12 (13th)? Wait, no, \( n = 14 \), so data points are indexed 1 - 14:
1:1, 2:2, 3:2, 4:3, 5:3, 6:4, 7:4, 8:5, 9:5, 10:6, 11:7, 12:8, 13:9, 14:12
First half (1 - 7): [1, 2, 2, 3, 3, 4, 4] → median (Q1) is the 4th value: 3
Second half (8 - 14): [5, 5, 6, 7, 8, 9, 12] → median (Q3) is the 4th value: 7
Maximum: 12
Now, the box - plot has a box from Q1 to Q3, a line at the median, and whiskers to min and max.
Looking at the box - plot: the x - axis is labeled "Hours Playing Video Games" with marks at 2, 4, 6, 8, 10, 12.
The left whisker should go to min = 1, but the plot shows the left whisker starting at 2? Wait, no, the plot's x - axis starts at 2? Wa…
Step 1: Count data for "less than 3 hours"
Data points: 1, 2, 2. Count: \( 1 + 2=3 \). Gracie's first statement is correct.
Step 2: Count data for "at least 3 and less than 6 hours"
Data points: 3, 3, 4, 4, 5, 5. Count: \( 3 + 3=6 \). Gracie said 5, so this is the error.
Step 3: Count data for "at least 6 and less than 9 hours"
Data points: 6, 7, 8. Count: \( 1+1 + 1=3 \). Gracie's third statement is correct.

Snap & solve any problem in the app
Get step-by-step solutions on Sovi AI
Photo-based solutions with guided steps
Explore more problems and detailed explanations
(Example 2 Error):
Gracie's error is in the statement "5 students spend at least 3 and less than 6 hours on assignments" (actual count is 6).