QUESTION IMAGE
Question
integrated math 1 - unit 6 name.
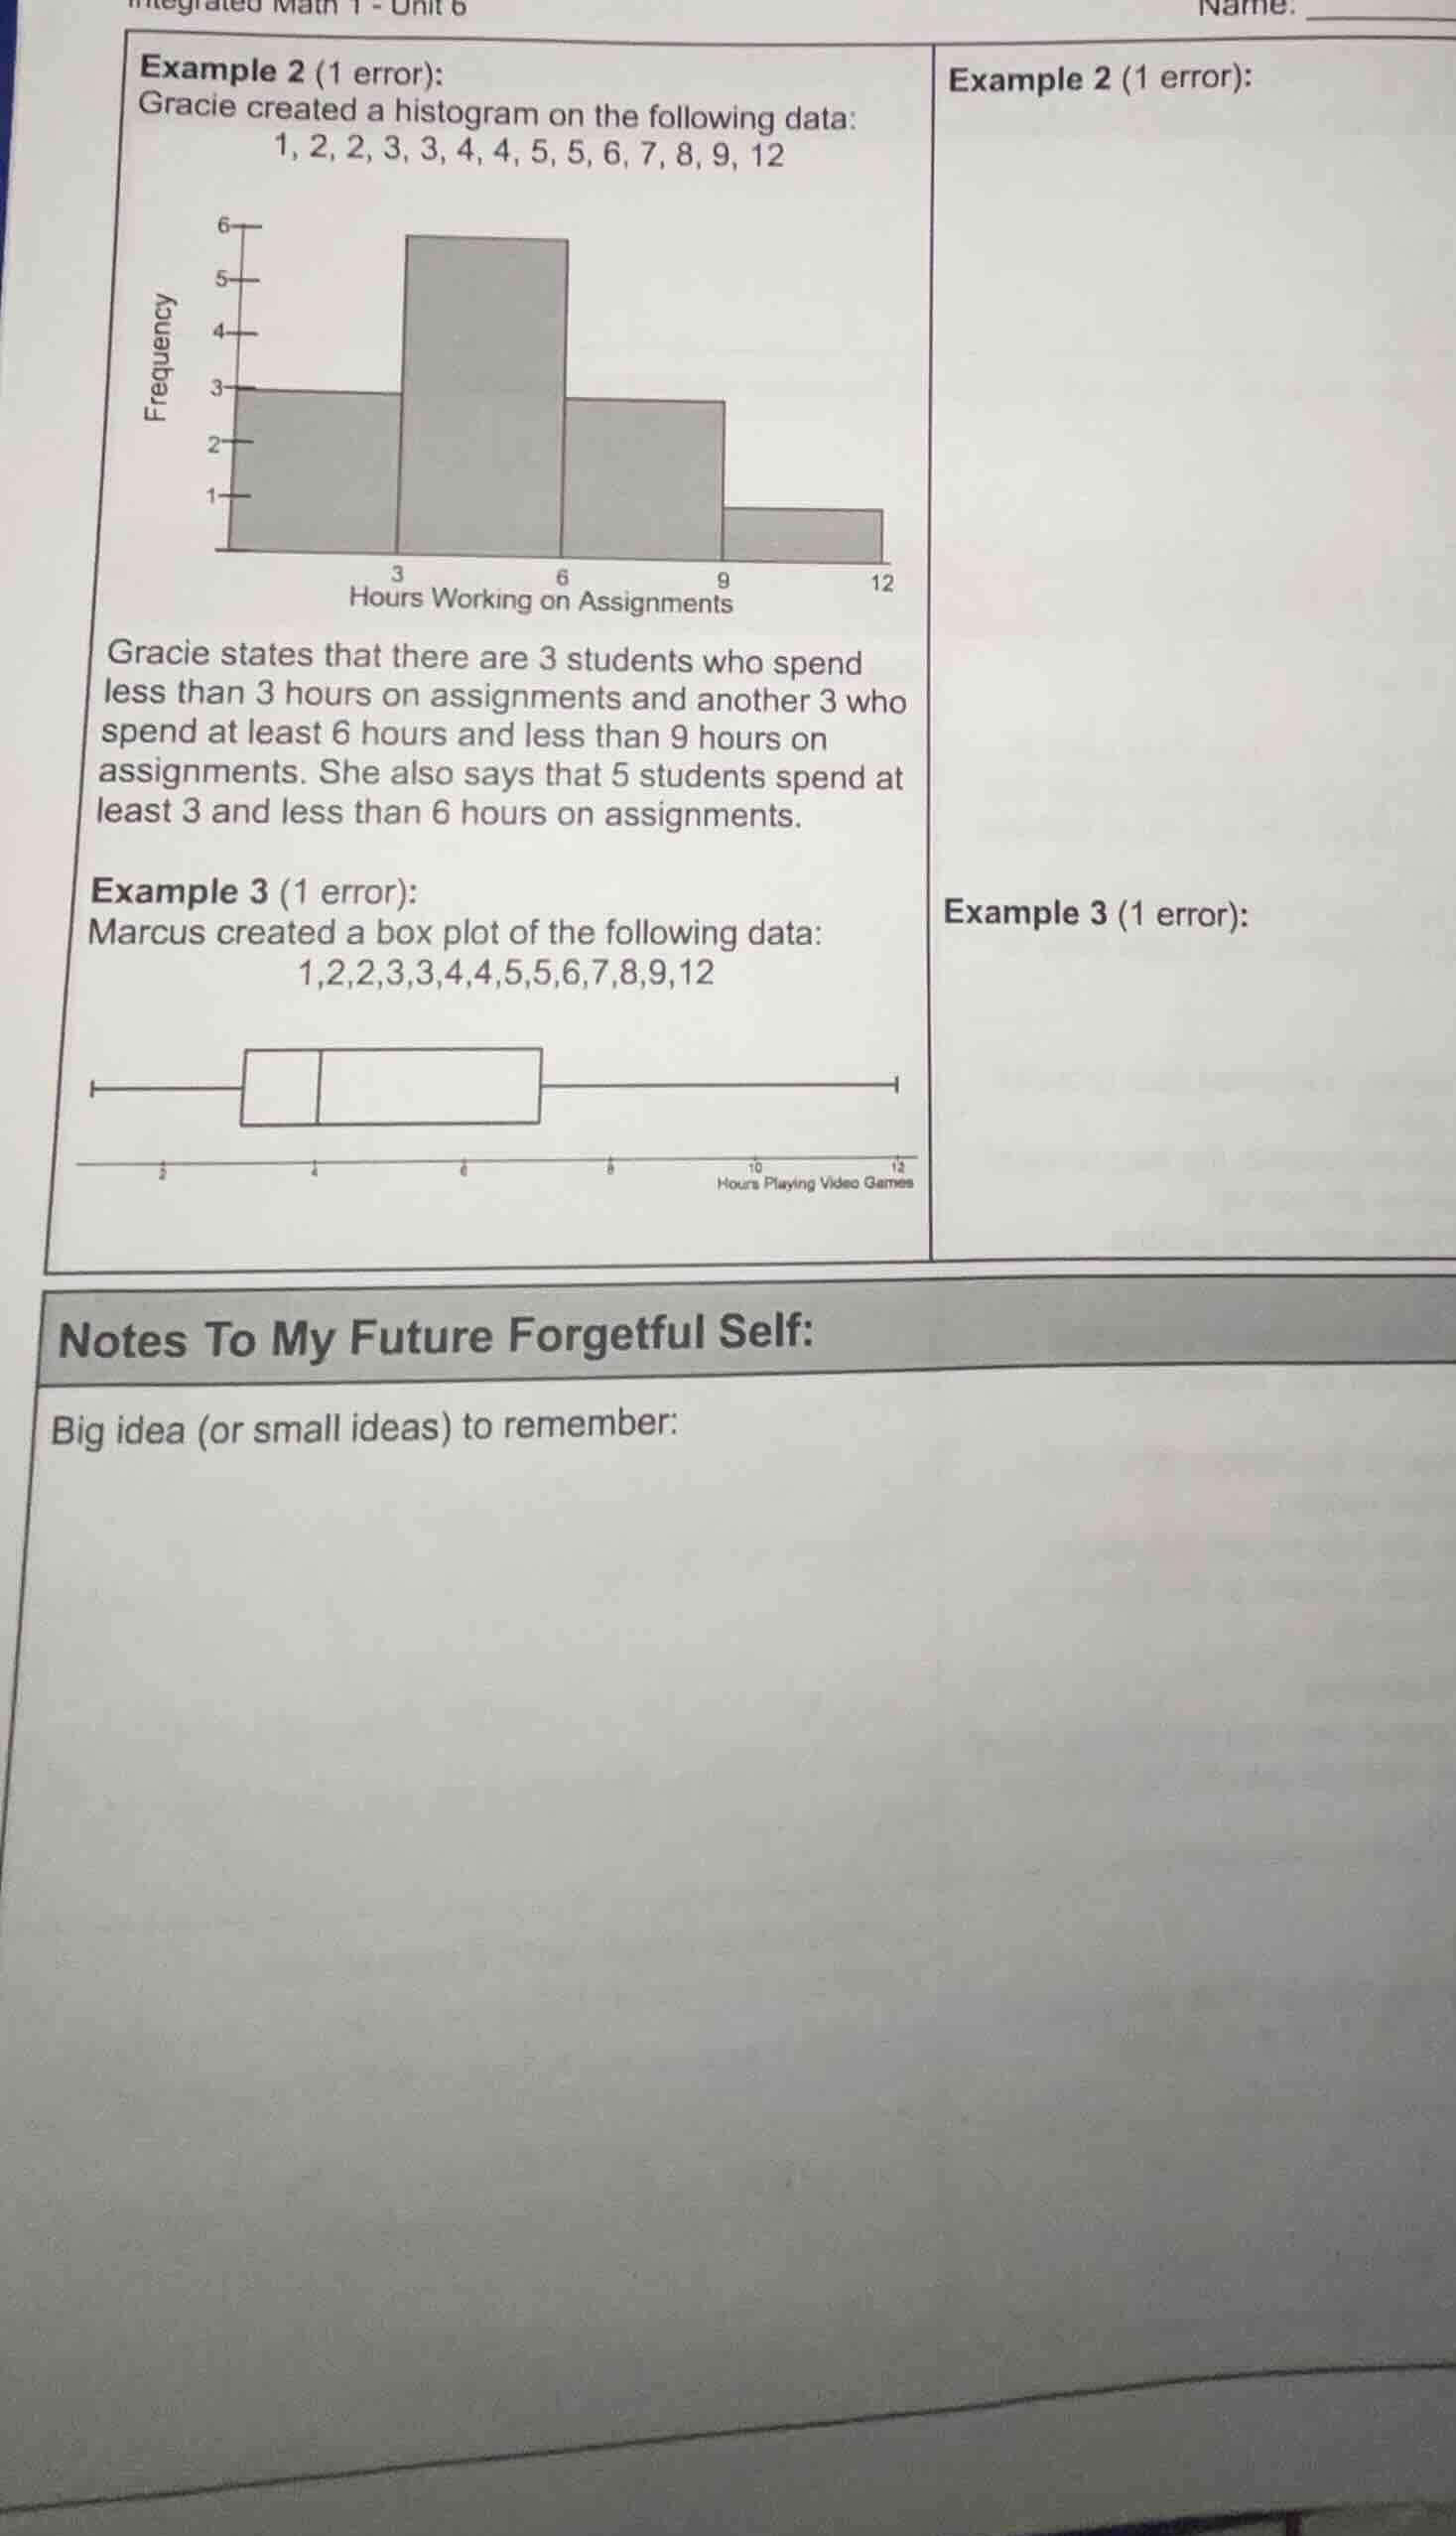
example 2 (1 error):
gracie created a histogram on the following data:
1, 2, 2, 3, 3, 4, 4, 5, 5, 6, 7, 8, 9, 12
gracie states that there are 3 students who spend
less than 3 hours on assignments and another 3 who
spend at least 6 hours and less than 9 hours on
assignments. she also says that 5 students spend at
least 3 and less than 6 hours on assignments.
example 3 (1 error):
marcus created a box plot of the following data:
1,2,2,3,3,4,4,5,5,6,7,8,9,12
notes to my future forgetful self:
big idea (or small ideas) to remember:
To identify the error in Gracie's histogram analysis (Example 2):
Step 1: Analyze "less than 3 hours"
The data points less than 3 are \(1, 2, 2\). Count: \(3\) (correct as Gracie said 3).
Step 2: Analyze "at least 3 and less than 6 hours"
Data points: \(3, 3, 4, 4, 5, 5\). Count: \(6\) (Gracie said 5 – error here).
Step 3: Analyze "at least 6 and less than 9 hours"
Data points: \(6, 7, 8\). Count: \(3\) (correct as Gracie said 3).
Step 4: Analyze the last interval (≥9)
Data points: \(9, 12\). Count: \(2\) (histogram shows frequency 1 – possible error, but Gracie didn't comment here).
For Marcus' box - plot (Example 2):
Step 1: Order the data
Data: \(1, 2, 2, 3, 3, 4, 4, 5, 5, 6, 7, 8, 9, 12\) (14 values).
Step 2: Find quartiles
- Median (Q2): Middle of 14 values is between 7th (\(4\)) and 8th (\(5\)) → \(Q2=\frac{4 + 5}{2}=4.5\).
- Q1: Median of first 7 values (\(1, 2, 2, 3, 3, 4, 4\)) → 4th value \(= 3\).
- Q3: Median of last 7 values (\(5, 5, 6, 7, 8, 9, 12\)) → 4th value \(= 7\).
The box - plot should have Q1 at \(3\), Q2 at \(4.5\), Q3 at \(7\). If Marcus' box - plot misrepresents these quartiles (e.g., wrong Q1, Q2, or Q3 position, or whisker length), that's the error. For example, if the box is drawn with incorrect quartile positions (like Q1 not at \(3\), Q2 not at \(4.5\), Q3 not at \(7\)) or whiskers (min \(= 1\), max \(= 12\)) are misdrawn.

Snap & solve any problem in the app
Get step-by-step solutions on Sovi AI
Photo-based solutions with guided steps
Explore more problems and detailed explanations
(for Example 2 error):
Gracie’s error is in the “at least 3 and less than 6 hours” count. The correct count is \(6\) (data: \(3, 3, 4, 4, 5, 5\)), but she said \(5\).
(For Example 3, the error likely relates to incorrect quartile placement or whisker length in the box - plot, based on the calculated quartiles above.)