QUESTION IMAGE
Question
interpreting data
grabbing pretzels
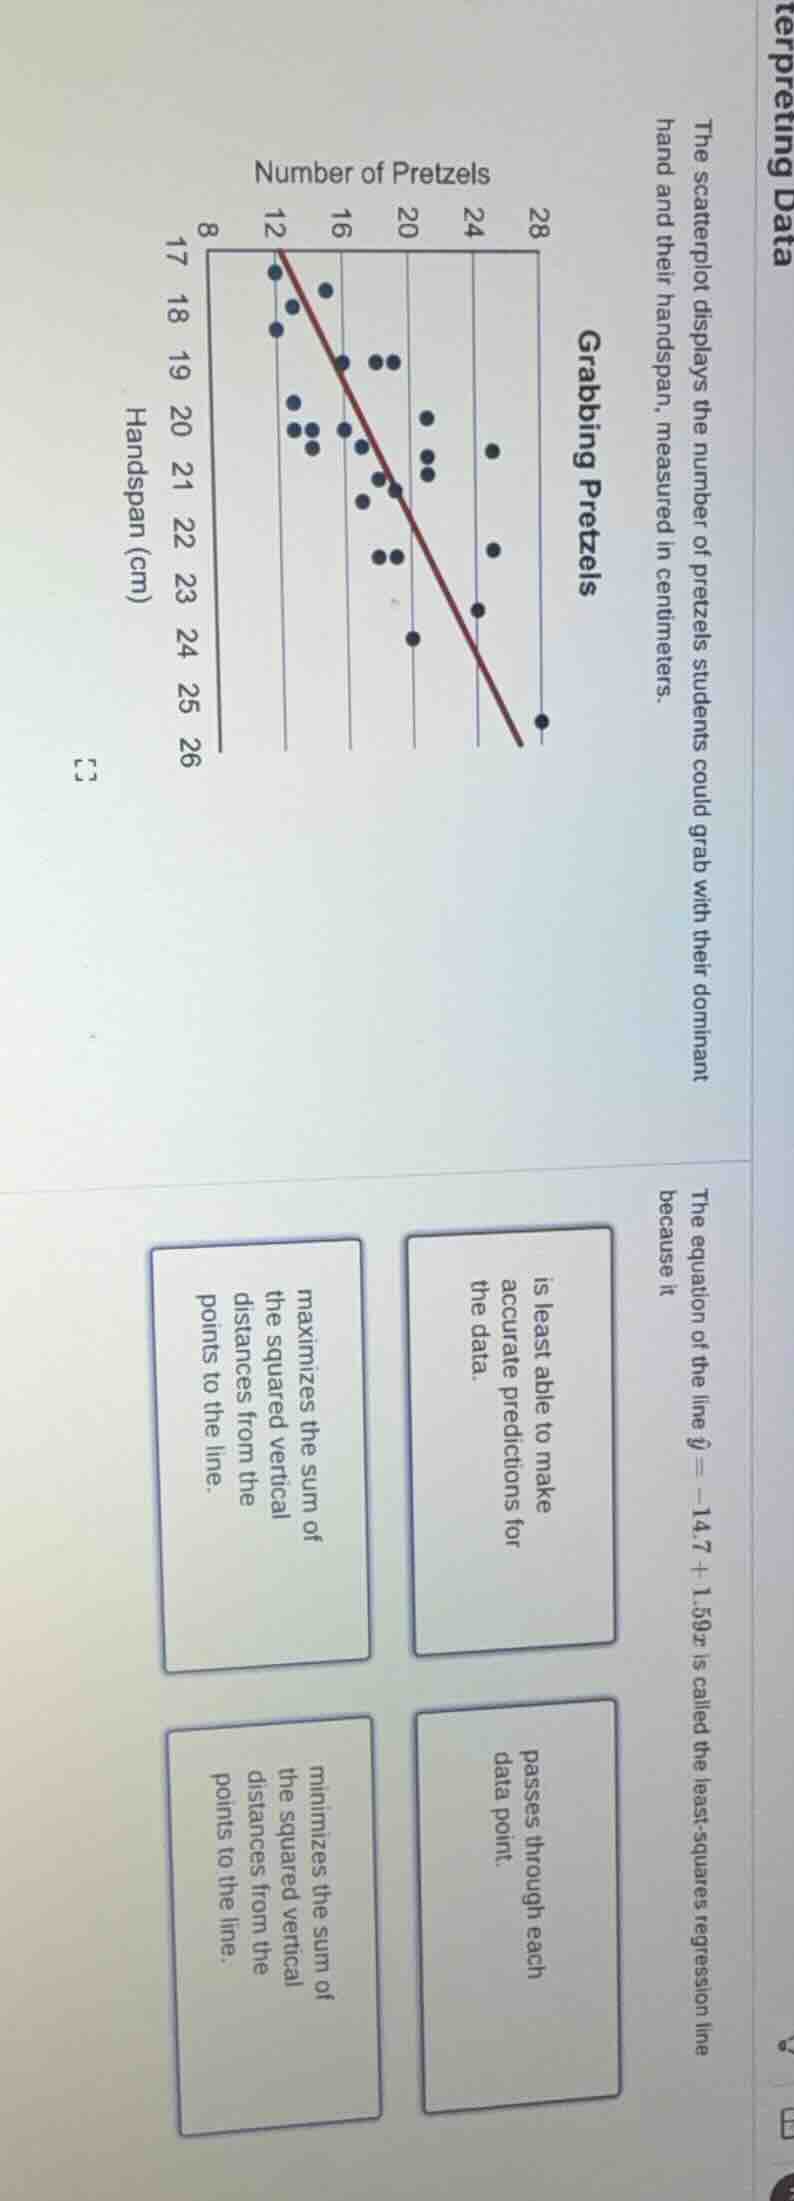
the scatterplot displays the number of pretzels students could grab with their dominant hand and their handspan, measured in centimeters.
scatterplot: x - axis: number of pretzels (8,12,16,20,24,28); y - axis: handspan (cm) (17 - 26). a red line is drawn through the points.
the equation of the line \\(\hat{y} = - 14.7 + 1.59x\\) is called the least - squares regression line because it
option 1: is least able to make accurate predictions for the data.
option 2: maximizes the sum of the squared vertical distances from the points to the line.
option 3: passes through each data point.
option 4: minimizes the sum of the squared vertical distances from the points to the line.
La recta de regresión de mínimos cuadrados se define como la línea que reduce al mínimo la suma de los cuadrados de las distancias verticales entre los puntos de datos y la línea. Las otras opciones son incorrectas: no pasa por cada punto, no maximiza esas distancias y sí es la que hace predicciones más precisas.

Snap & solve any problem in the app
Get step-by-step solutions on Sovi AI
Photo-based solutions with guided steps
Explore more problems and detailed explanations
minimizes the sum of the squared vertical distances from the points to the line.