QUESTION IMAGE
Question
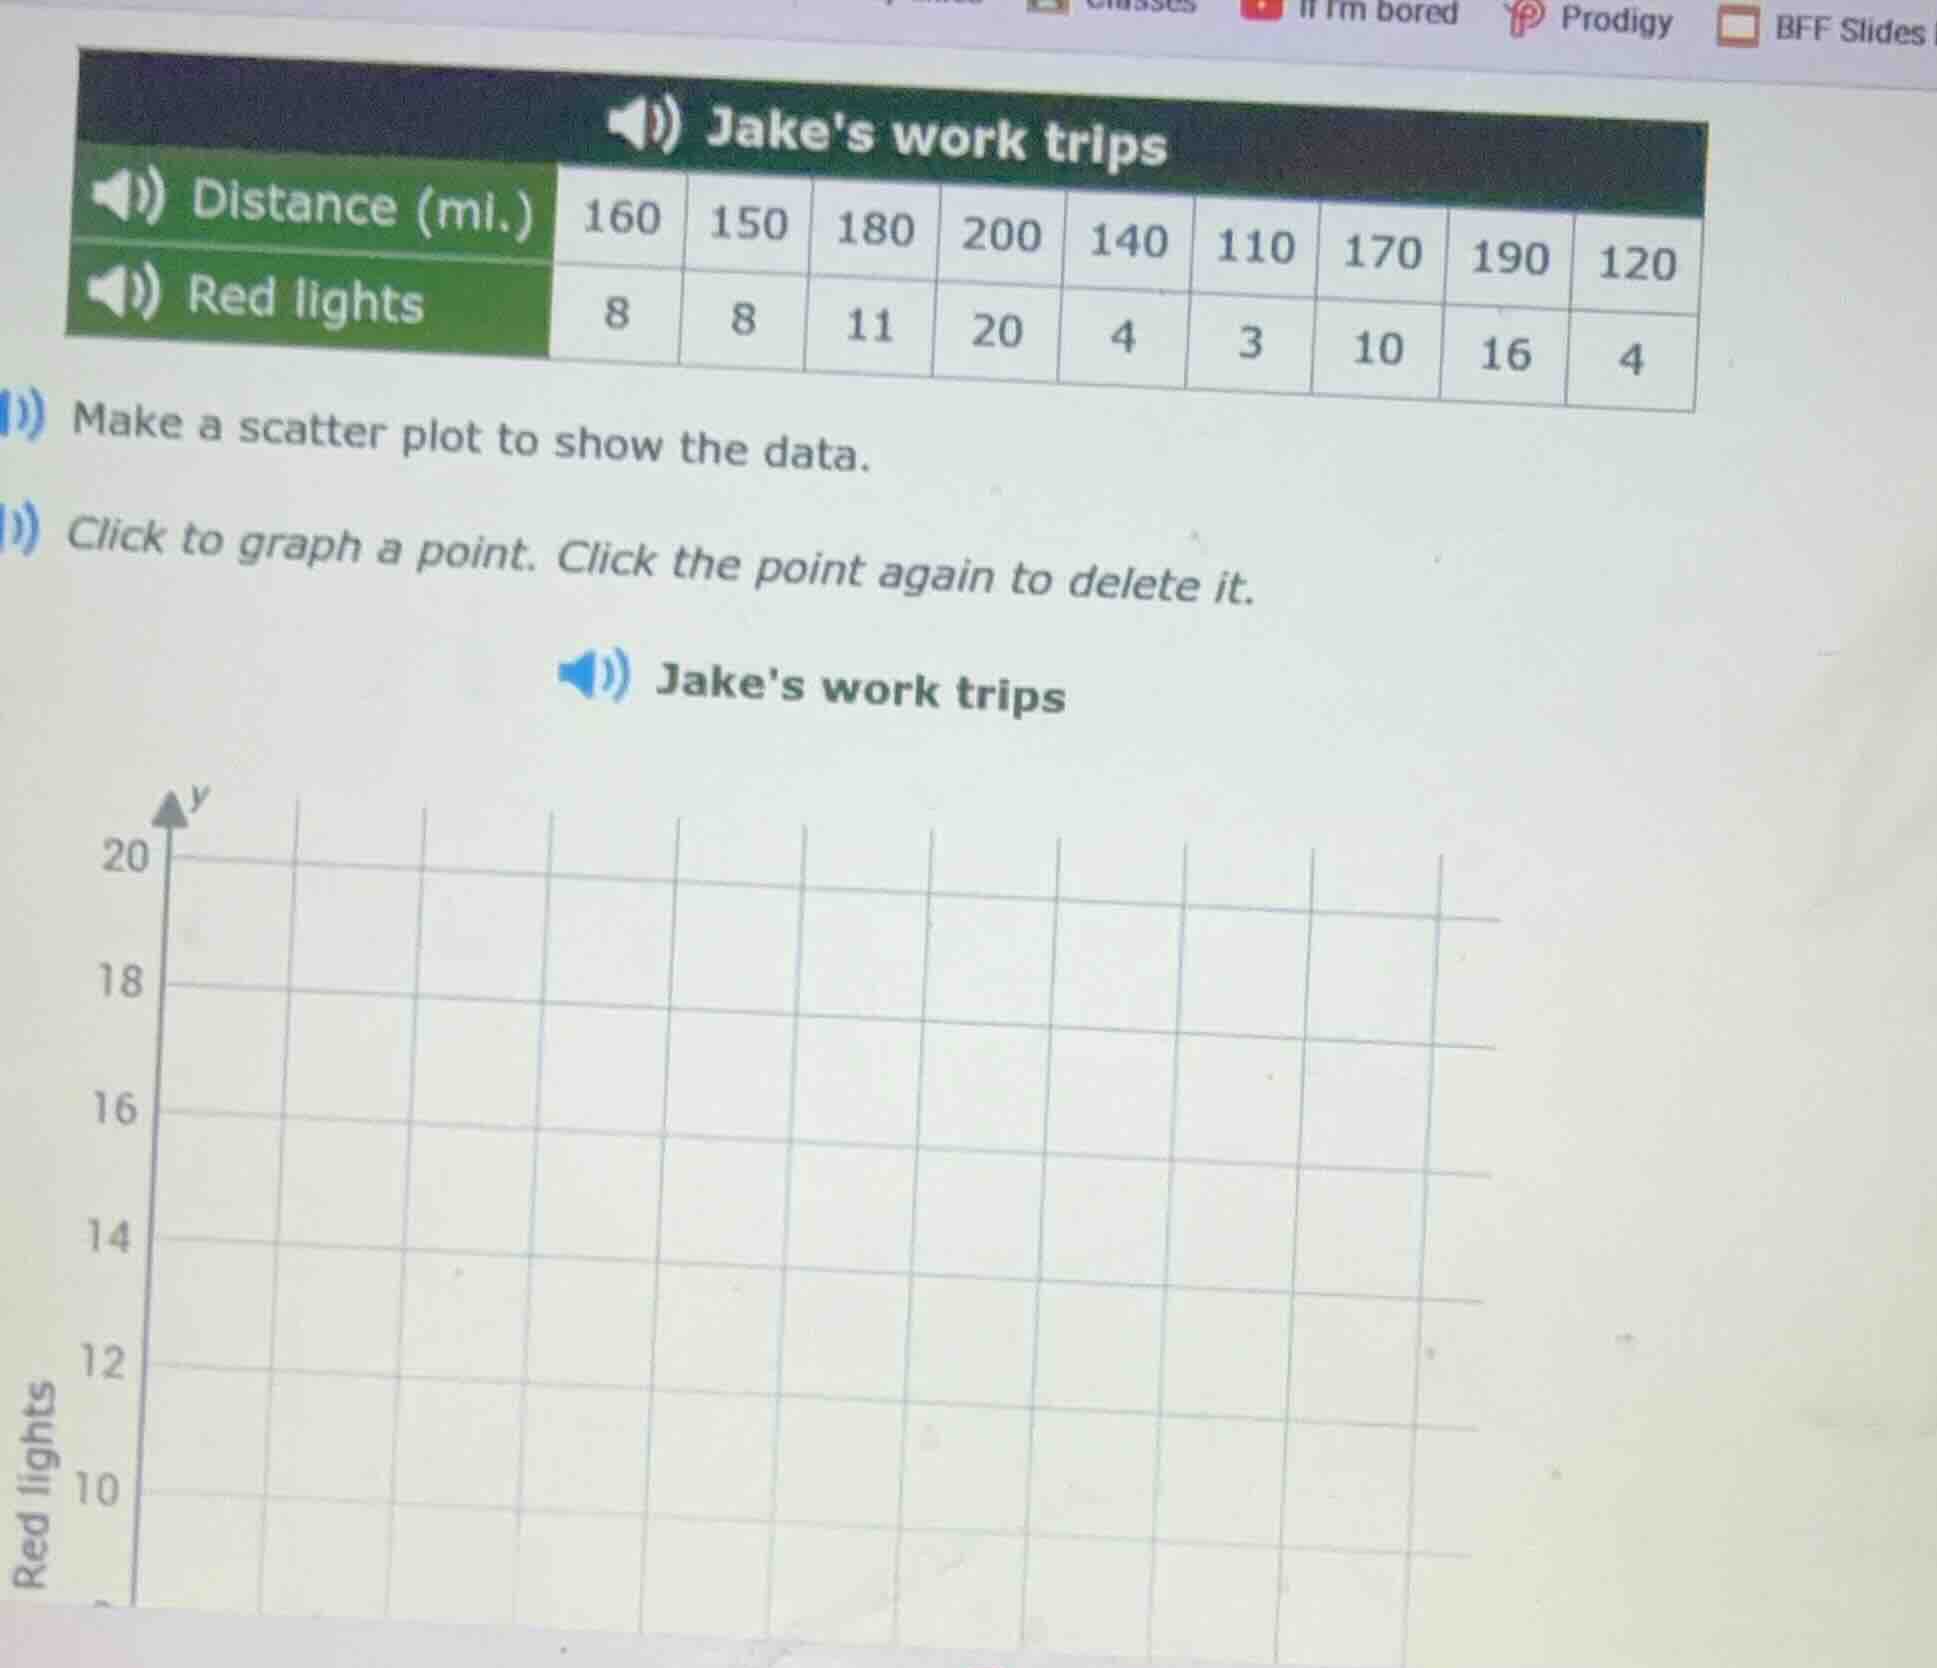
jakes work trips
distance (mi.): 160, 150, 180, 200, 140, 110, 170, 190, 120
red lights: 8, 8, 11, 20, 4, 3, 10, 16, 4
make a scatter plot to show the data.
click to graph a point. click the point again to delete it.
jakes work trips
(graph with y - axis labeled red lights, values from 0 to 20, and x - axis for distance (mi.))
Step1: Identify x and y variables
The x - variable (independent variable) is the distance in miles, and the y - variable (dependent variable) is the number of red lights. We have the following data points: (160, 8), (150, 8), (180, 11), (200, 20), (140, 4), (110, 3), (170, 10), (190, 16), (120, 4).
Step2: Plot each point
- For the point (160, 8): Locate 160 on the x - axis (distance) and 8 on the y - axis (red lights) and mark the point.
- For the point (150, 8): Locate 150 on the x - axis and 8 on the y - axis and mark the point.
- For the point (180, 11): Locate 180 on the x - axis and 11 on the y - axis and mark the point.
- For the point (200, 20): Locate 200 on the x - axis and 20 on the y - axis and mark the point.
- For the point (140, 4): Locate 140 on the x - axis and 4 on the y - axis and mark the point.
- For the point (110, 3): Locate 110 on the x - axis and 3 on the y - axis and mark the point.
- For the point (170, 10): Locate 170 on the x - axis and 10 on the y - axis and mark the point.
- For the point (190, 16): Locate 190 on the x - axis and 16 on the y - axis and mark the point.
- For the point (120, 4): Locate 120 on the x - axis and 4 on the y - axis and mark the point.

Snap & solve any problem in the app
Get step-by-step solutions on Sovi AI
Photo-based solutions with guided steps
Explore more problems and detailed explanations
The scatter plot is created by plotting the points (160, 8), (150, 8), (180, 11), (200, 20), (140, 4), (110, 3), (170, 10), (190, 16), (120, 4) on the graph where the x - axis represents distance (in miles) and the y - axis represents the number of red lights.