QUESTION IMAGE
Question
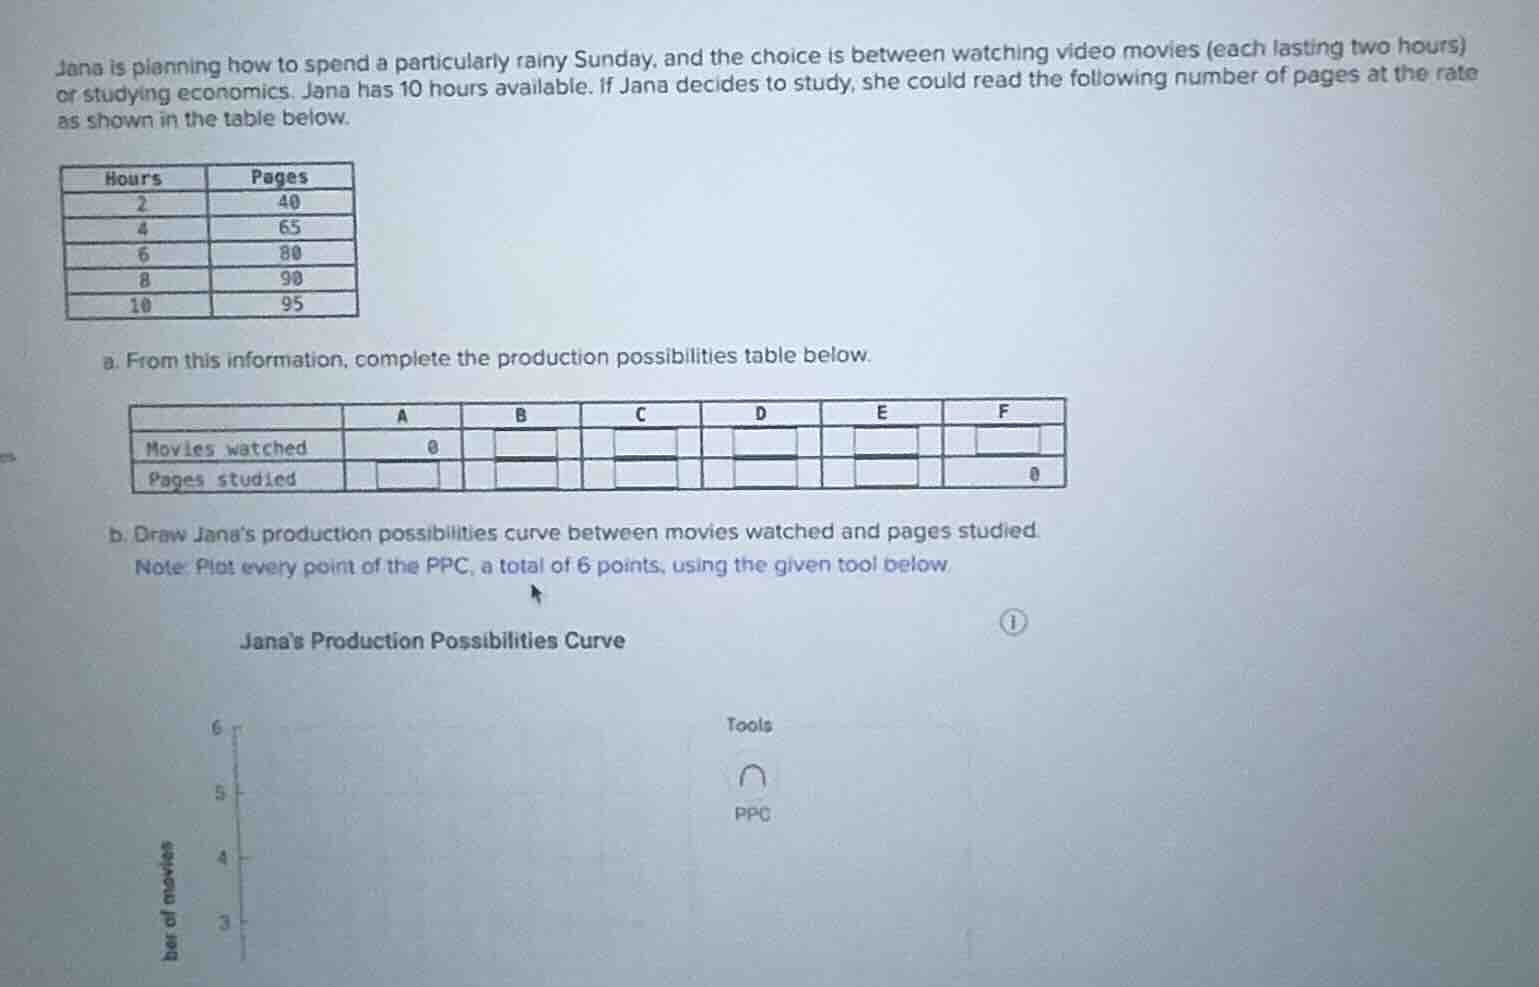
jana is planning how to spend a particularly rainy sunday, and the choice is between watching video movies (each lasting two hours) or studying economics. jana has 10 hours available. if jana decides to study, she could read the following number of pages at the rate as shown in the table below.
| hours | pages |
|---|---|
| 4 | 65 |
| 6 | 80 |
| 8 | 90 |
| 10 | 95 |
a. from this information, complete the production possibilities table below.
| a | b | c | d | e | f | |
|---|---|---|---|---|---|---|
| pages studied | 0 |
b. draw jana’s production possibilities curve between movies watched and pages studied
note: plot every point of the ppc, a total of 6 points, using the given tool below.
jana’s production possibilities curve
(graph with per of movies on y - axis and other axis, and a tools section with ppc tool)
Step1: Calculate max movies
Each movie takes 2 hours, total time = 10 hours.
Maximum number of movies = $\frac{10}{2} = 5$
Step2: Map time to options
For each number of movies, calculate time spent on movies, then find remaining time for studying, and match to pages from the table:
- Point A: 0 movies → 10 hours studying → 95 pages
- Point B: 1 movie → $2\times1=2$ hours on movies, $10-2=8$ hours studying → 90 pages
- Point C: 2 movies → $2\times2=4$ hours on movies, $10-4=6$ hours studying → 80 pages
- Point D: 3 movies → $2\times3=6$ hours on movies, $10-6=4$ hours studying → 65 pages
- Point E: 4 movies → $2\times4=8$ hours on movies, $10-8=2$ hours studying → 40 pages
- Point F: 5 movies → $2\times5=10$ hours on movies, 0 hours studying → 0 pages

Snap & solve any problem in the app
Get step-by-step solutions on Sovi AI
Photo-based solutions with guided steps
Explore more problems and detailed explanations
Part a: Completed Production Possibilities Table
| A | B | C | D | E | F | |
|---|---|---|---|---|---|---|
| Pages studied | 95 | 90 | 80 | 65 | 40 | 0 |
Part b: Production Possibilities Curve Instructions
Plot the following 6 coordinate points (number of movies, pages studied) on the graph and connect them with a curve:
- (0, 95)
- (1, 90)
- (2, 80)
- (3, 65)
- (4, 40)
- (5, 0)
The curve will be downward-sloping and bowed outward, showing increasing opportunity cost.