QUESTION IMAGE
Question
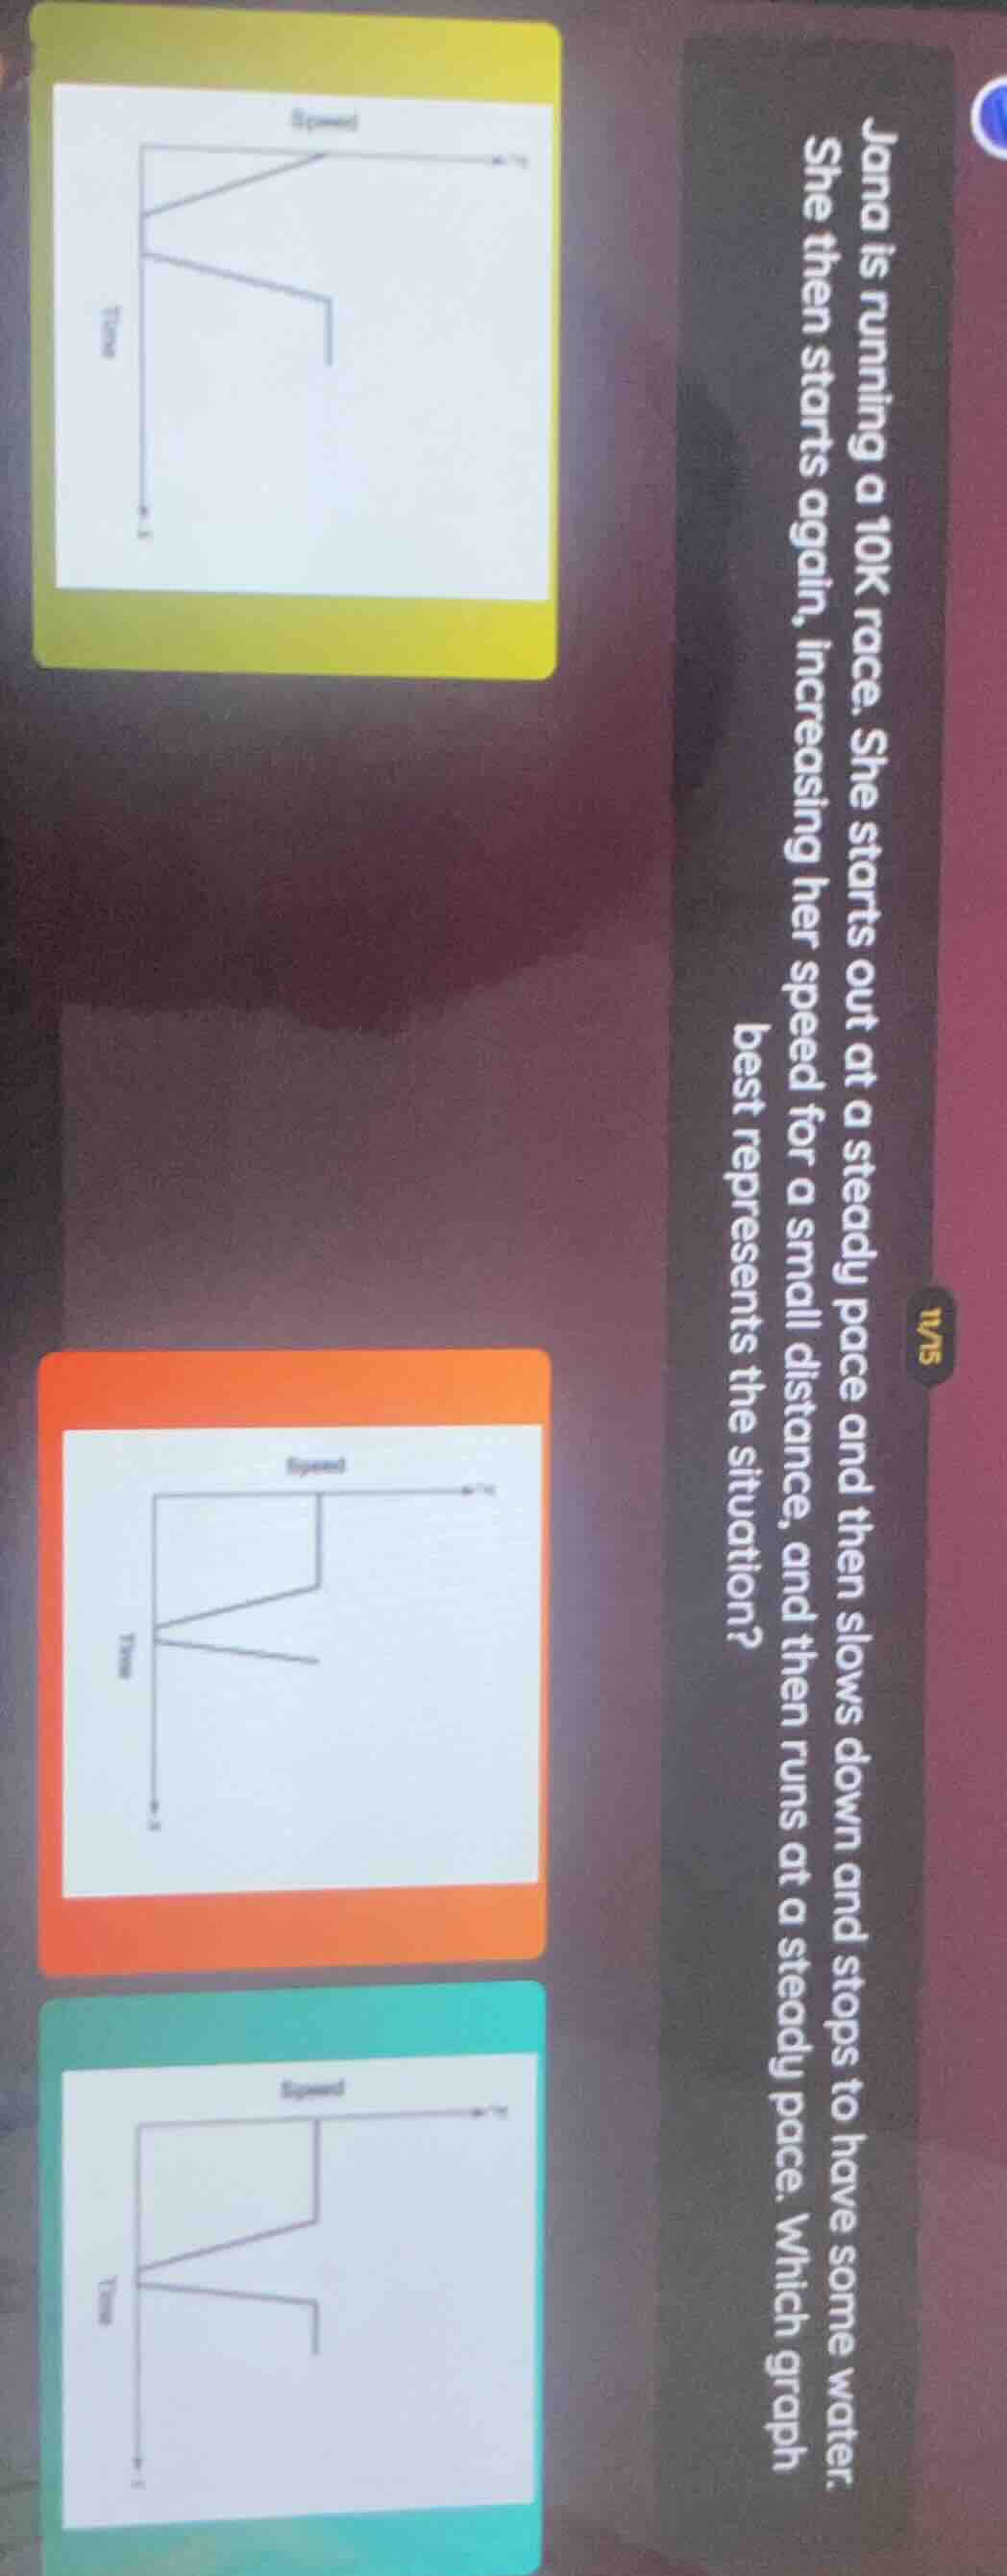
jana is running a 10k race. she starts out at a steady pace and then slows down and stops to have some water. she then starts again, increasing her speed for a small distance, and then runs at a steady pace. which graph best represents the situation?
Step1: Analyze the running phases
Jana's running has three phases: steady pace (constant speed), slow down and stop (speed decreases to 0), then start again, increase speed (speed rises), and steady pace (constant speed).
Step2: Match with graphs
- The first (yellow) graph: Let's check the speed - time. It should have a constant speed, then decrease to 0 (stop), then increase (speed up) and then constant. Wait, but the key is the phases. Wait, the correct graph should show: initial constant speed (horizontal line), then decreasing speed (line going down) to 0 (stop, speed 0 for some time? No, she stops to have water, so speed 0? Wait, no, when she slows down and stops, speed becomes 0. Then she starts again, increases speed (line going up) and then constant speed (horizontal line).
Looking at the three graphs (yellow, orange, teal). Wait, the teal graph: Let's see the phases. Wait, the correct graph should have:
- Steady pace: speed constant (horizontal line).
- Slows down: speed decreases (line with negative slope) to 0 (speed = 0, maybe a horizontal line at 0 for a moment? But maybe the graph shows speed decreasing to 0, then increasing (positive slope) and then constant (horizontal line).
Wait, the teal graph (the bottom one) probably has these phases. Wait, maybe the correct graph is the teal one? Wait, no, let's re - read the problem.
Wait, the problem says: She starts out at a steady pace (speed constant), then slows down and stops (speed goes to 0), then starts again, increasing her speed for a small distance (so speed increases, so the graph has a line with positive slope), and then runs at a steady pace (speed constant).
So the graph should have:
- First segment: horizontal line (constant speed).
- Second segment: line with negative slope (decreasing speed) to 0.
- Third segment: line with positive slope (increasing speed).
- Fourth segment: horizontal line (constant speed).
Looking at the three graphs, the teal - colored graph (the bottom one) likely has these segments. Wait, maybe the correct graph is the teal one. But since the user's image has three graphs (yellow, orange, teal), and we need to identify which one.
Wait, maybe the teal graph is the correct one. Let's assume that the teal graph shows:
- Initial steady pace (horizontal), then slow down (slope down) to 0, then speed up (slope up), then steady (horizontal).
So the answer is the teal - colored graph (the bottom one in the image). But since we need to describe, but maybe the correct graph is the one with the four phases: constant, decrease, increase, constant.

Snap & solve any problem in the app
Get step-by-step solutions on Sovi AI
Photo-based solutions with guided steps
Explore more problems and detailed explanations
The teal - colored graph (the bottom - most graph in the provided image) best represents the situation.