QUESTION IMAGE
Question
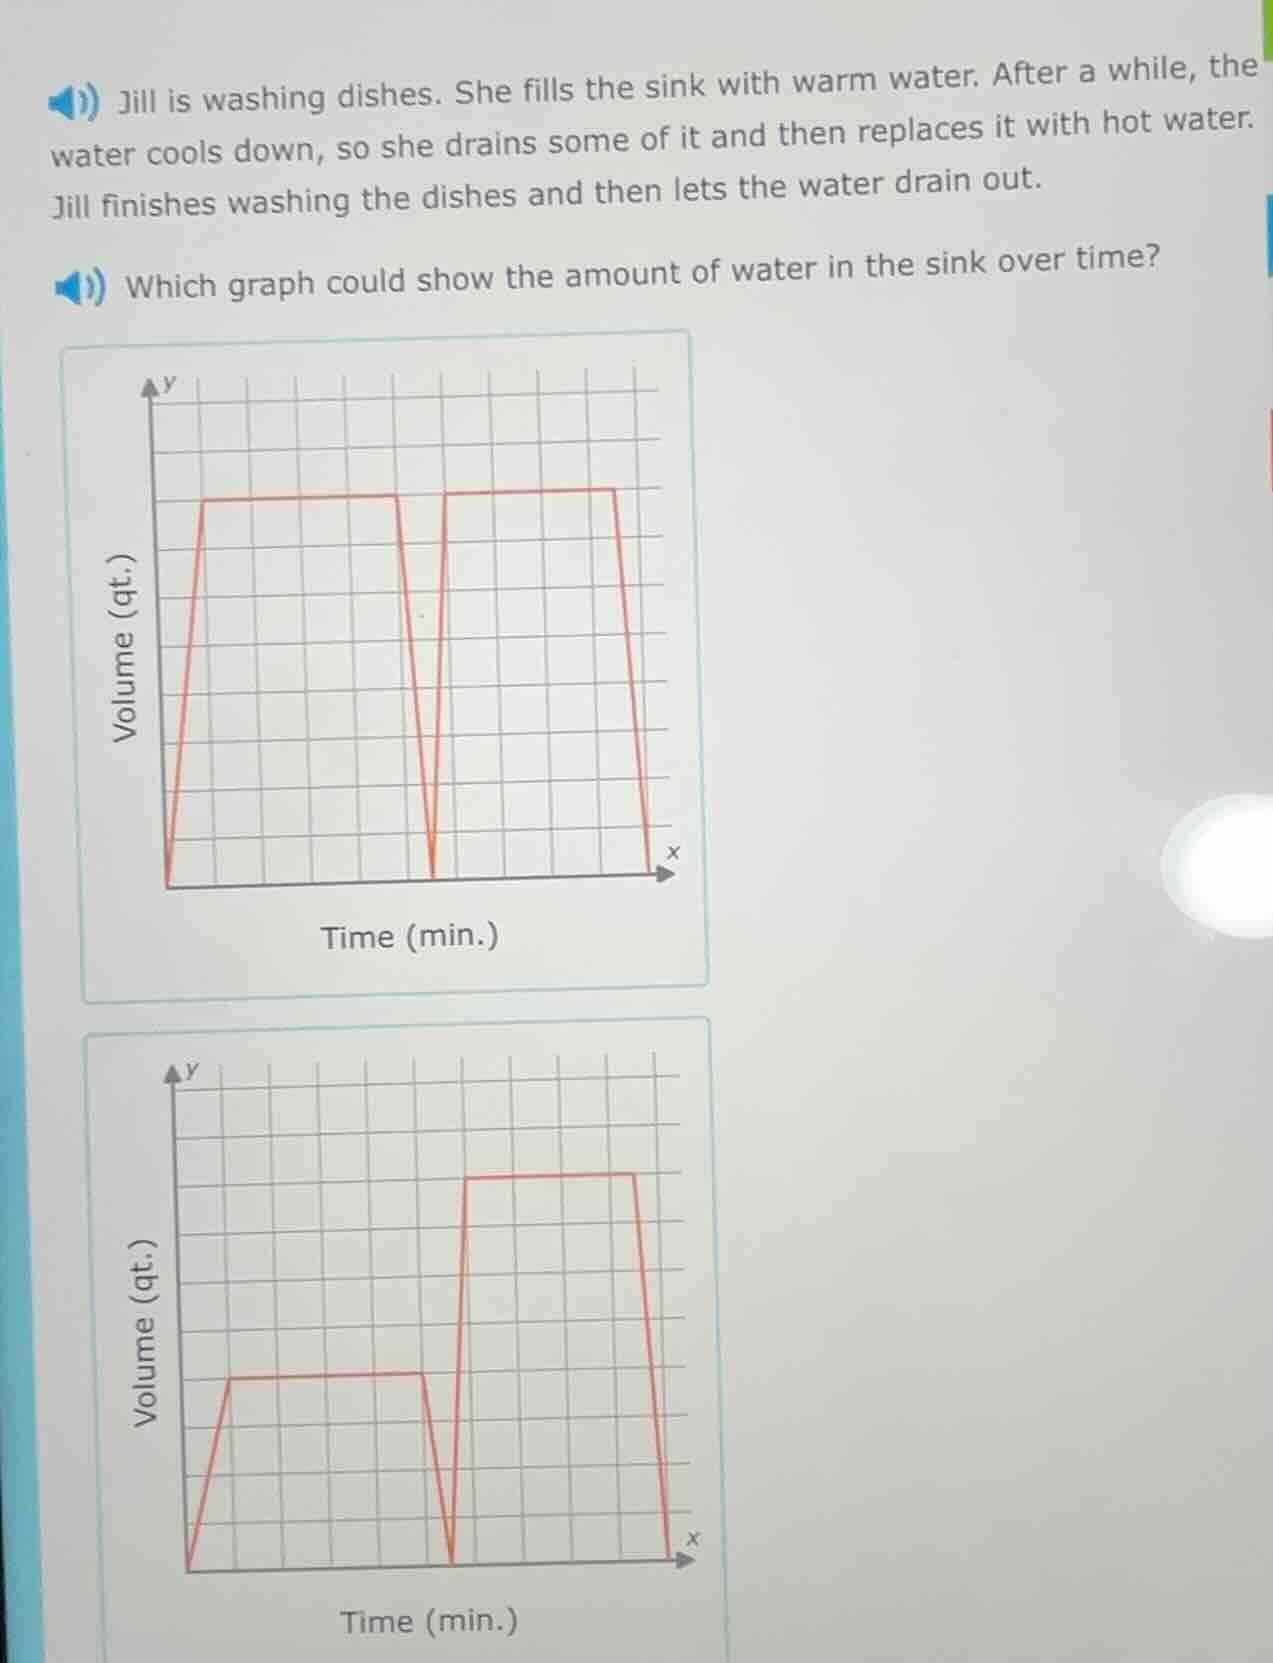
jill is washing dishes. she fills the sink with warm water. after a while, the water cools down, so she drains some of it and then replaces it with hot water. jill finishes washing the dishes and then lets the water drain out. which graph could show the amount of water in the sink over time? two graphs are shown with volume (qt.) on y - axis and time (min.) on x - axis, one with two horizontal segments at similar heights and another with two horizontal segments at different heights
- First, Jill fills the sink: volume increases to a steady level, held while washing initially.
- Next, she drains some water (not all) and replaces it with hot water: volume drops partially, then rises back to a steady level (likely similar to the original, as she replaces the drained amount).
- Finally, she drains all water: volume drops to 0.
The first graph drains all water before refilling, which does not match. The second graph shows a partial drain, then a refill to a new steady level, then a full drain, matching the sequence.

Snap & solve any problem in the app
Get step-by-step solutions on Sovi AI
Photo-based solutions with guided steps
Explore more problems and detailed explanations
The bottom graph (second graph with two different steady volume levels)