QUESTION IMAGE
Question
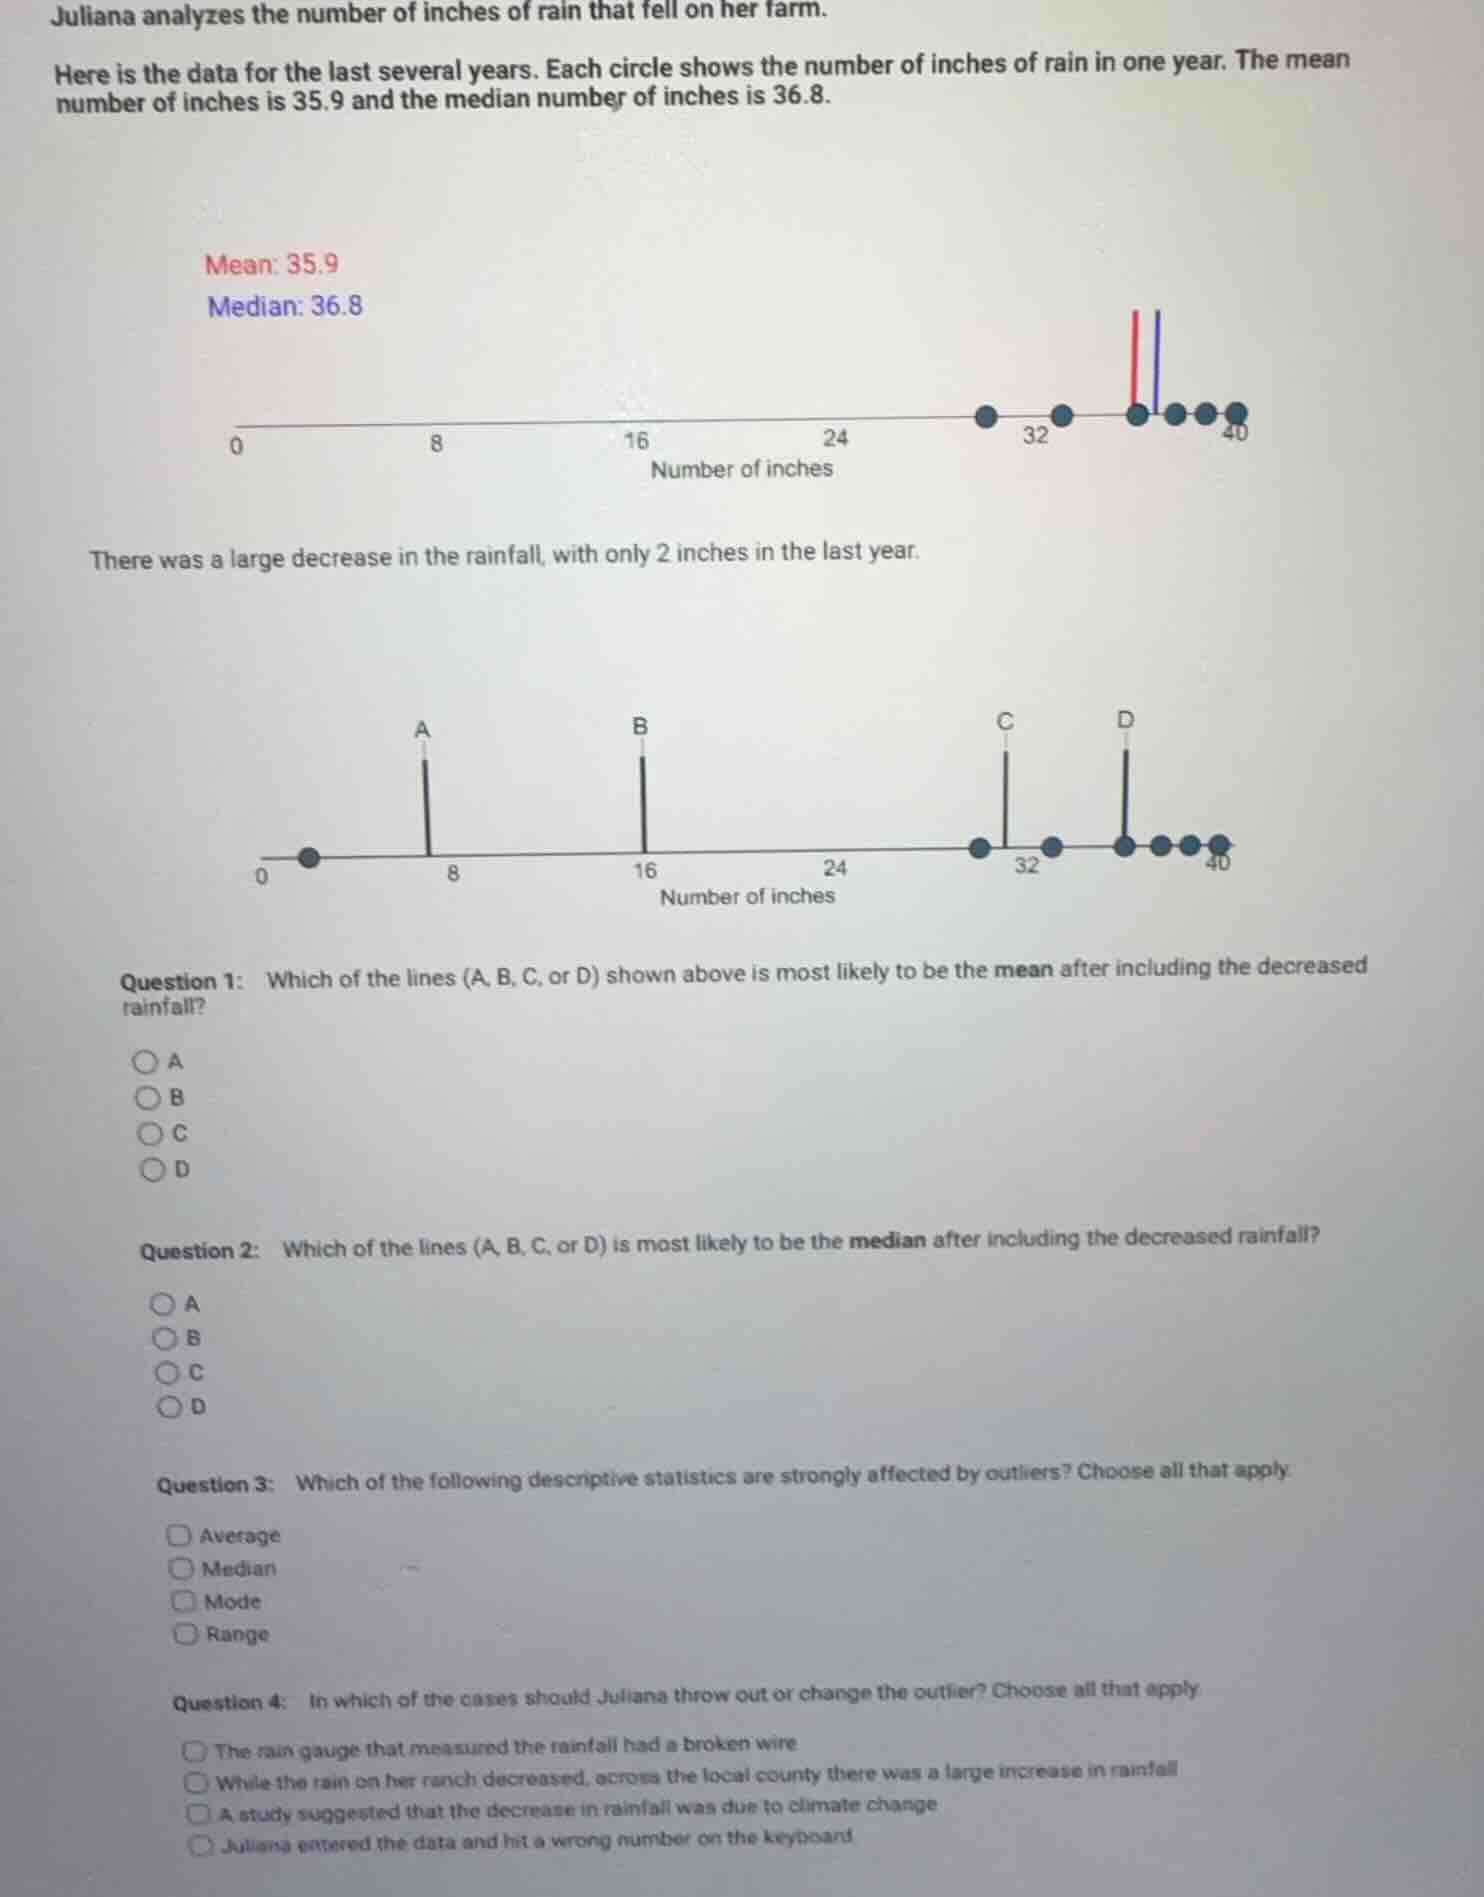
juliana analyzes the number of inches of rain that fell on her farm.
here is the data for the last several years. each circle shows the number of inches of rain in one year. the mean number of inches is 35.9 and the median number of inches is 36.8.
mean: 35.9
median: 36.8
image of a number line with circles at various points
there was a large decrease in the rainfall, with only 2 inches in the last year.
image of a number line with a circle at 0 and lines labeled a, b, c, d at various points
question 1: which of the lines (a, b, c, or d) shown above is most likely to be the mean after including the decreased rainfall?
options: a, b, c, d
question 2: which of the lines (a, b, c, or d) is most likely to be the median after including the decreased rainfall?
options: a, b, c, d
question 3: which of the following descriptive statistics are strongly affected by outliers? choose all that apply.
options: average, median, mode, range
question 4: in which of the cases should juliana throw out or change the outlier? choose all that apply
options: the rain gauge that measured the rainfall had a broken wire; while the rain on her ranch decreased, across the local county there was a large increase in rainfall; a study suggested that the decrease in rainfall was due to climate change; juliana entered the data and hit a wrong number on the keyboard
Step1: Analyze mean with outlier
The original mean is 35.9. Adding a very low outlier (2 inches) will pull the mean downward significantly, so it will be much lower than the original mean, matching line A.
Step2: Analyze median with outlier
Original data has 5 points, median is the 3rd value (36.8). Adding 1 outlier makes 6 points; median is the average of the 3rd and 4th values, which are still in the upper cluster, so median stays near the original, matching line C.
Step3: Identify stats affected by outliers
Mean (average) is pulled by extreme values; range = max - min, so outliers change min/max drastically. Median and mode are resistant to outliers.
Step4: Identify valid outlier removal cases
Outliers are only removed if the data is invalid (measurement error, data entry error). Valid data (climate change, regional difference) should not be removed.

Snap & solve any problem in the app
Get step-by-step solutions on Sovi AI
Photo-based solutions with guided steps
Explore more problems and detailed explanations
Question 1: A
Question 2: C
Question 3: Average, Range
Question 4: The rain gauge that measured the rainfall had a broken wire; Juliana entered the data and hit a wrong number on the keyboard