QUESTION IMAGE
Question
jump to level 1
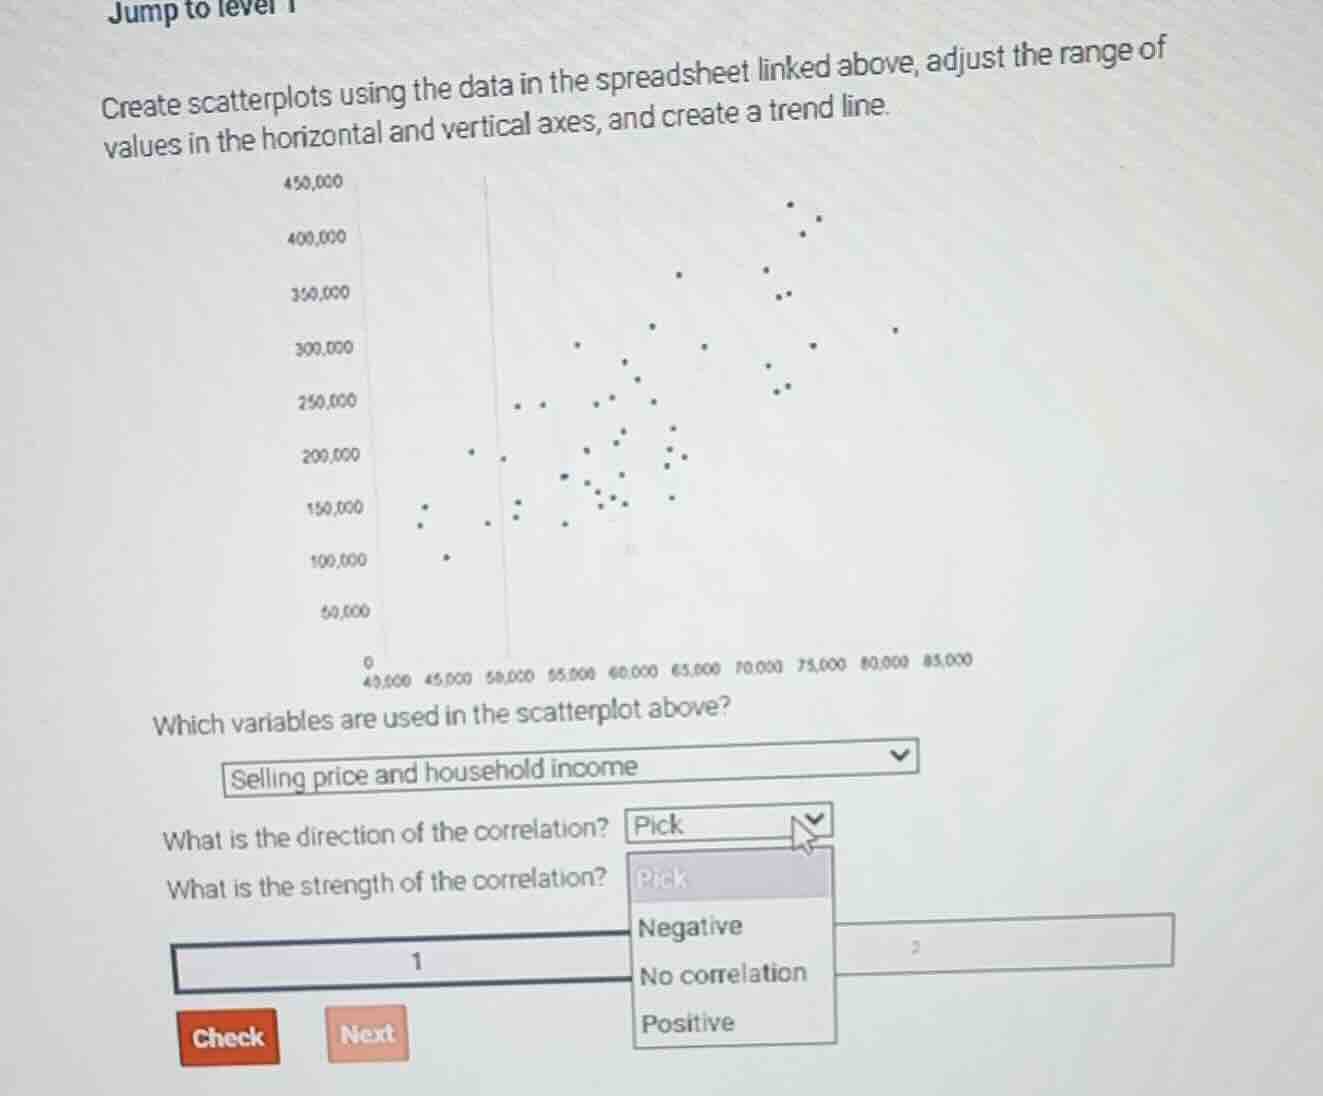
create scatterplots using the data in the spreadsheet linked above, adjust the range of values in the horizontal and vertical axes, and create a trend line.
which variables are used in the scatterplot above?
selling price and household income
what is the direction of the correlation? pick
what is the strength of the correlation? pick
Brief Explanations
- For correlation direction: As the horizontal axis (household income) increases, the vertical axis (selling price) generally increases, so the correlation is positive.
- For correlation strength: The points cluster in a clear upward pattern, not tightly packed but with a distinct trend, indicating a moderate positive correlation.

Snap & solve any problem in the app
Get step-by-step solutions on Sovi AI
Photo-based solutions with guided steps
Explore more problems and detailed explanations
What is the direction of the correlation? Positive
What is the strength of the correlation? Moderate positive correlation