QUESTION IMAGE
Question
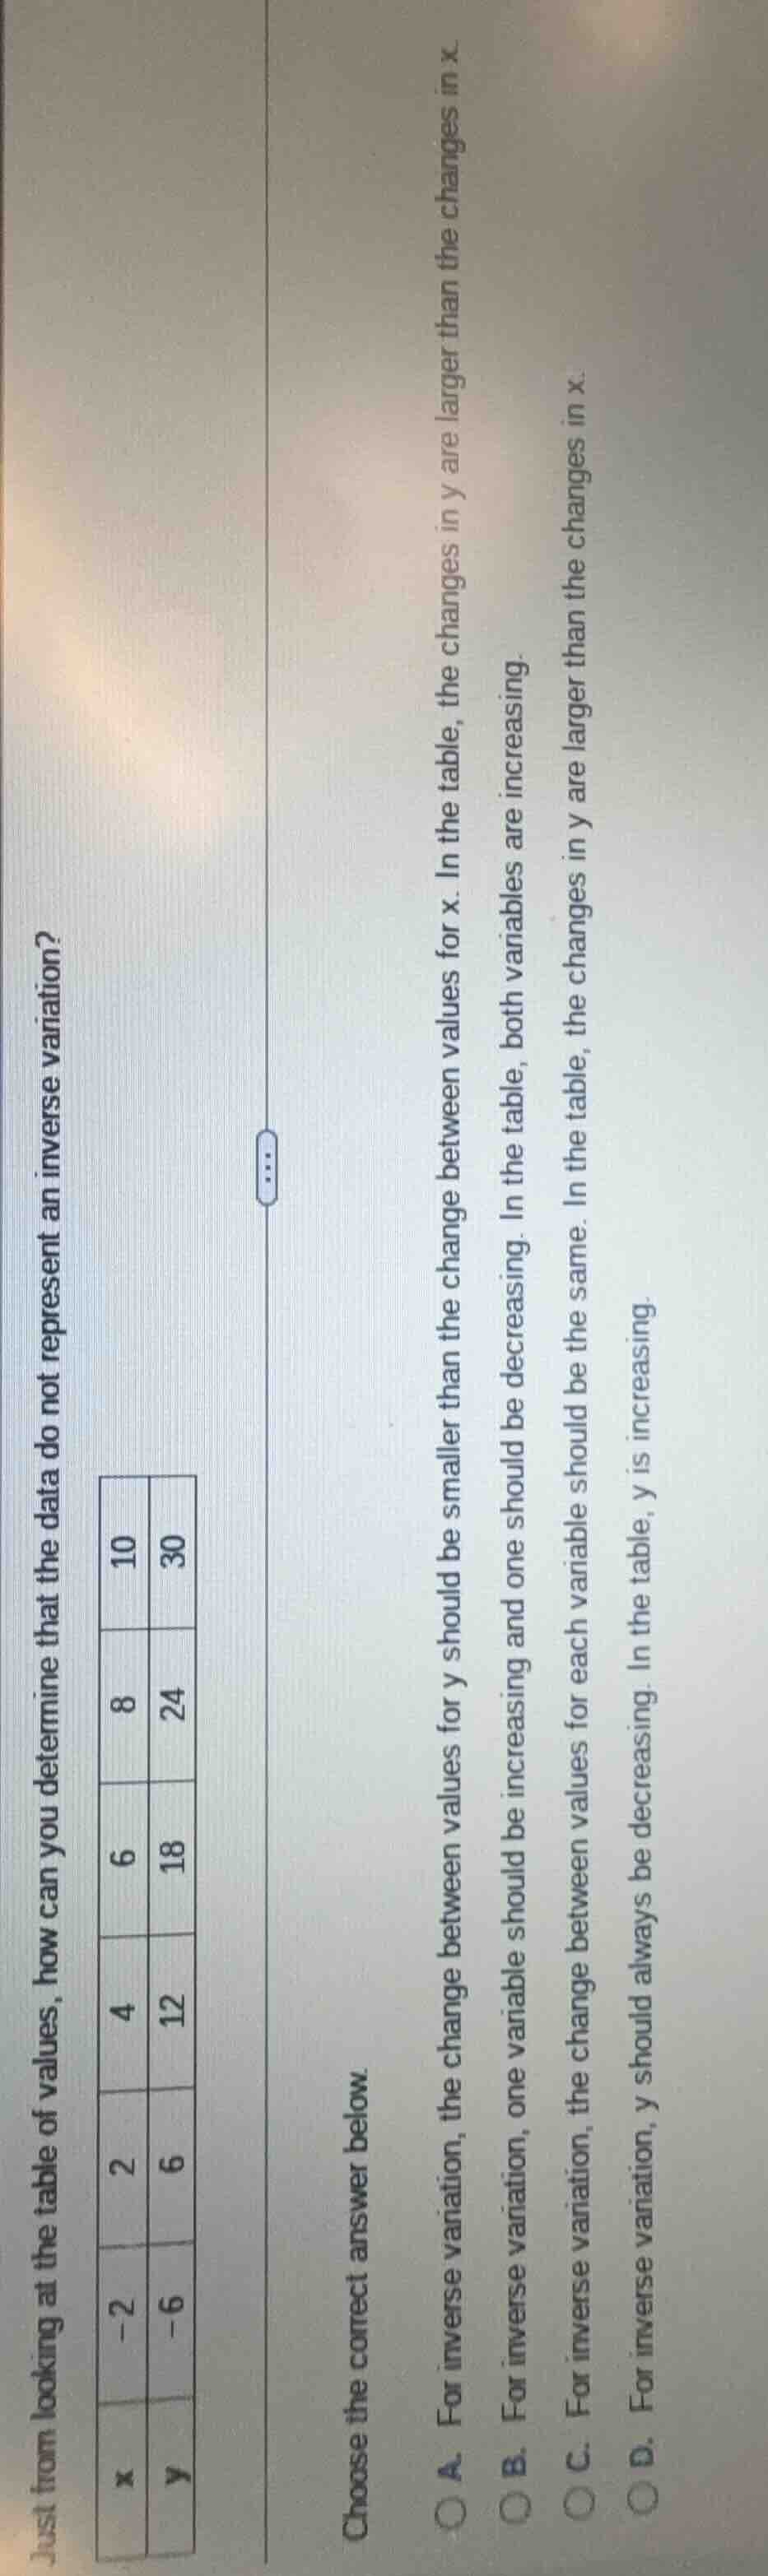
just from looking at the table of values, how can you determine that the data do not represent an inverse variation?
choose the correct answer below.
a. for inverse variation, the change between values for y should be smaller than the change between values for x. in the table, the changes in y are larger than the changes in x.
b. for inverse variation, one variable should be increasing and one should be decreasing. in the table, both variables are increasing.
c. for inverse variation, the change between values for each variable should be the same. in the table, the changes in y are larger than the changes in x.
d. for inverse variation, y should always be decreasing. in the table, y is increasing.
Inverse variation has the property that as one variable increases, the other decreases (and vice versa), which reflects an inverse relationship. In the given table, as $x$ increases, $y$ also increases, violating this core trait of inverse variation. Additionally, inverse variation follows $xy = k$ (constant), but here $\frac{y}{x}=3$ (direct variation), not inverse. The key visual check is the direction of change for the variables.

Snap & solve any problem in the app
Get step-by-step solutions on Sovi AI
Photo-based solutions with guided steps
Explore more problems and detailed explanations
B. For inverse variation, one variable should be increasing and one should be decreasing. In the table, both variables are increasing.